| Issue |
A&A
Volume 606, October 2017
|
|
|---|---|---|
| Article Number | A131 | |
| Number of page(s) | 3 | |
| Section | Extragalactic astronomy | |
| DOI | https://doi.org/10.1051/0004-6361/201731372 | |
| Published online | 24 October 2017 | |
A 85 kpc Hα tail behind 2MASX J11443212+2006238 in A1367⋆
1 Università degli Studi di Milano-Bicocca, Piazza della Scienza 3, 20126 Milano, Italy
e-mail: This email address is being protected from spambots. You need JavaScript enabled to view it.
2 Optical and Infrared Astronomy Division, National Astronomical Observatory of Japan, Mitaka, 181-8588 Tokyo, Japan
e-mail: This email address is being protected from spambots. You need JavaScript enabled to view it.
3 Graduate School of Science and Engineering, Hosei University, 3-7-2, Kajinocho, Koganei, 184-8584 Tokyo, Japan
4 Subaru Telescope, National Astronomical Observatory of Japan, National Institutes of Natural Sciences, 650 A’ohoku Place, Hilo, HI 96720, USA
Received: 14 June 2017
Accepted: 26 August 2017
Abstract
We report the detection of an Hα trail of 85 kpc projected length behind galaxy 2MASX J11443212+2006238 in the nearby cluster of galaxies Abell 1367. This galaxy was discovered to possess an extended component in earlier, deeper Hα observations carried out with the Subaru telescope. However, lying at the border of the Subaru field, the extended Hα tail was cut out, preventing the determination of its full extent. We fully map this extent here, albeit the shallower exposure.
Key words: galaxies: evolution / galaxies: clusters: individual: A1367 / galaxies: individual: 2MASX J11443212+2006238 / galaxies: interactions
Based on observations taken at the San Pedro Martir telescope belonging to the Mexican National Observatory (OAN).
© ESO, 2017
1. Introduction
A 1.5 deg2 region of the nearby cluster of galaxies Abell 1367 (z ~ 0.0217) was recently surveyed with deep Hα observations using the Subaru telescope (Yagi et al. 2017). These observations, at the limiting surface brightness of 2.5 × 10⁻¹⁸ erg cm-2 s-1 arcsec-2, revealed the presence of Hα tails behind ten out of the cluster’s 26 late-type galaxies (LTG) that were surveyed. This indicates that, when observed with sufficiently deep observations, approximately 40% of all LTGs in this cluster reveal an associated extended trail of Hα, in agreement with the frequency obtained in the Coma cluster by Yagi et al. (2010). This evidence strengthens previous suggestions that a massive infall of gas-rich, star forming galaxies (100–400 galaxies per Gyr, Adami et al. 2005; Boselli et al. 2008; Gavazzi et al. 2012, 2013a,b) is occurring at the present epoch onto rich clusters of galaxies such as Coma and Virgo. This estimate derives from the combined evidence that ionized tails arise from the ram pressure stripping (Gunn & Gott 1972) of galaxies crossing the intracluster medium at high speed for the first time, and that the gas ablation produced by such interaction proceeds on timescales as short as 100 Myr (Boselli & Gavazzi 2006, 2014).
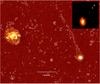 |
Fig. 1 Gray-scale representation of the Hα emission from CGCG 97-121 (left) and 2MASX J11443212+2006238 (right), with levels chosen to highlight the bright part of the emission. Smoothed (by 2.8 arcsec) contours of the Hα-NET image show the low-brightness, extended tail behind 2MASX J11443212+2006238 whose maximum projected length is 85 kpc. North is at the top and east to the left. |
Observational parameters of the two target galaxies.
The galaxy 2MASX J11443212+2006238 lies very close to the edge of the Subaru field (see Fig. 9 of Yagi et al. 2017), preventing a robust measurement of the extended Hα flux and of its total length. Guided by these observations, we decided to devote two entire (moon free, clear but not photometric) nights of observations at the 2.1 m telescope of the San Pedro Martir observatory to the field containing 2MASX J11443212+2006238 and another cluster member: CGCG 97-121 (Zwicky et al. 1961–68). In spite of the three-times-shallower data obtained with our smaller telescope, we could detect the full extent of the Hα emission trailing behind 2MASX J11443212+2006238.
2. Observations
On the nights of April 24 and 25, 2017, we used the 2.1 m telescope at San Pedro Martir to repeatedly observe a 5 × 5 arcmin2 region of the nearby cluster of galaxies Abell 1367. We used a narrow (80 Å) band filter centered at 6723 Å to detect the Hα emission (at the mean redshift z ~ 0.0217 of the cluster) and a broad band r (Gunn) filter (effective λ 6231 Å, Δλ ~ 1200 Å) to recover the continuum emission.
The field, which contains both 2MASX J11443212+ 2006238 and CGCG 97-121, was observed with 33 independent pointings of 900 s with the ON-band filter, and with 25 pointings of 180 s with the broad band (OFF-band) r filter. After flat-fielding, the aligned observations were combined into a final ON-band frame totalling 8.25 h exposure, and an OFF-band frame of 1.25 h exposure (details on the reduction procedures of Hα observations can be found in Gavazzi et al. 2012). To calibrate the data, which were observed in clear sky conditions, we used the Sloan Digital Sky Survey (SDSS) nuclear fiber spectrum of 2MASX J11443212+2006238 from which we measure an Hα point-like flux (within the central 3 arcsec) of 2.45 × 10⁻¹⁴erg cm-2 s-1 Å-1. Assuming this flux within the 3′′ central aperture of the galaxy, we derive an effective zero point for our observations of –15.29 erg cm-2 s-1 this should be compared with –15.54 obtained in the previous photometric nights and we estimate a limiting surface brightness at Hα ≈ 7.9 × 10⁻¹⁸ erg cm-2 s-1 arcsec-2.
3. Results
In Table 1 we list the celestial coordinates, redshift, total stellar mass, and total equivalent width (EW) and flux separately for 2MASX J11443212+2006238, for the diffuse trailing material, and for CGCG 97-121. The flux of the diffuse gas of 2MASX J11443212+20062 (in parenthesis) is measured in a polygonal aperture that fits the last contour level shown in Fig. 1. Stellar masses were derived from the i-band luminosity and the g−i color according to Zibetti et al. (2009), assuming a Chabrier initial mass function (IMF; Chabrier 2003). Figure 1 shows the continuum subtracted Hα image of our field smoothed by 2.8 arcsec, from which we measured the extent of the diffuse flux associated to 2MASX J11443212+2006238. Assuming a distance from Abell 1367 of 95 Mpc, the tail extends in the NE direction for ≈85 kpc. Such a distance can be covered in ≈85 Myr by a galaxy travelling at approximately 1000 km s-1, which is the typical velocity of galaxies in clusters. Given that this length is typical in Abell 1367 (the tail length ranges from 15 to 230 kpc in this cluster, Yagi et al. 2017), 85–100 Myr can be assumed as the typical time during which the tails remain visible. This time is longer than the typical electron recombination time, recently estimated as 0.2 Myr for UGC 6697 (Consolandi et al. 2017) and even shorter for ESO137-001 (Fossati et al. 2016), suggesting the existence of some mechanism capable of keeping the gas ionized for a longer period of time in the wakes of the extended tails. However, 100 Myr is a rather short period of time in cosmic history. This suggests that the ram pressure stripping phenomenon occurs during the first pericenter passage over a short period of time, consistent with the evidence of truncated star formation at the southern side (opposite to the tail) of 2MASX J11443212+20062 (Yagi et al. 2017), which could indicate quenching timescales as short as 100 Myr (see Boselli et al. 2006, 2016a,b). The very existence of 11 tails of similar typical length allows us to roughly estimate the infall rate of galaxies in A1367 as 130 per Gyr, consistent with other existing estimates for Coma and Virgo.
Acknowledgments
This research has made use of the GOLDmine database (Gavazzi et al. 2003, 2014b) and of the NASA/IPAC Extragalactic Database (NED), which is operated by the Jet Propulsion Laboratory, California Institute of Technology, under contract with the National Aeronautics and Space Administration.
References
- Adami, C., Biviano, A., Durret, F., & Mazure, A. 2005, A&A, 443, 17 [NASA ADS] [CrossRef] [EDP Sciences] [Google Scholar]
- Boselli, A., & Gavazzi, G. 2006, PASP, 118, 517 [NASA ADS] [CrossRef] [Google Scholar]
- Boselli, A., & Gavazzi, G. 2014, A&ARv, 22, 74 [NASA ADS] [CrossRef] [Google Scholar]
- Boselli, A., Boissier, S., Cortese, L., et al. 2006, ApJ, 651, 811 [NASA ADS] [CrossRef] [Google Scholar]
- Boselli, A., Boissier, S., Cortese, L., & Gavazzi, G. 2008, ApJ, 674, 742 [NASA ADS] [CrossRef] [Google Scholar]
- Boselli, A., Cuillandre, J. C., Fossati, M., et al. 2016a, A&A, 587, A68 [NASA ADS] [CrossRef] [EDP Sciences] [Google Scholar]
- Boselli, A., Roehlly, Y., Fossati, M., et al. 2016b, A&A, 596, A11 [NASA ADS] [CrossRef] [EDP Sciences] [Google Scholar]
- Chabrier, G. 2003, PASP, 115, 763 [NASA ADS] [CrossRef] [Google Scholar]
- Consolandi, G., Gavazzi, G., Fossati, M., et al. 2017, A&A, 606, A83 [NASA ADS] [CrossRef] [EDP Sciences] [Google Scholar]
- Fossati, M., Fumagalli, M., Boselli, A., et al. 2016, MNRAS, 455, 2028 [Google Scholar]
- Gavazzi, G., Boselli, A., Donati, A., Franzetti, P., & Scodeggio, M. 2003, A&A, 400, 451 [NASA ADS] [CrossRef] [EDP Sciences] [Google Scholar]
- Gavazzi, G., Fumagalli, M., Galardo, V., et al. 2012, A&A, 545, A16 [NASA ADS] [CrossRef] [EDP Sciences] [Google Scholar]
- Gavazzi, G., Fumagalli, M., Fossati, M., et al. 2013a, A&A, 553, A89 [NASA ADS] [CrossRef] [EDP Sciences] [Google Scholar]
- Gavazzi, G., Savorgnan, G., Fossati, M., et al. 2013b, A&A, 553, A90 [NASA ADS] [CrossRef] [EDP Sciences] [Google Scholar]
- Gavazzi, G., Franzetti, P., & Boselli, A. 2014, ArXiv e-prints [arXiv:1401.8123] [Google Scholar]
- Gunn, J. E., & Gott, III, J. R., 1972, ApJ, 176, 1 [NASA ADS] [CrossRef] [Google Scholar]
- Yagi, M., Yoshida, M., Komiyama, Y., et al. 2010, AJ, 140, 1814 [NASA ADS] [CrossRef] [Google Scholar]
- Yagi, M., Yoshida, M., Gavazzi, G., et al. 2017, ApJ, 839, 65 [NASA ADS] [CrossRef] [Google Scholar]
- Zibetti, S., Charlot, S., & Rix, H.-W. 2009, MNRAS, 400, 1181 [NASA ADS] [CrossRef] [Google Scholar]
- Zwicky, F., Herzog, E., Wild, P., Karpowicz, M., & Kowal, C. T. 1961–68, Catalogue of Galaxies and for clusters of Galaxies (Pasadena: California Institute of Technology (CIT)) [Google Scholar]
All Tables
All Figures
|
Fig. 1 Gray-scale representation of the Hα emission from CGCG 97-121 (left) and 2MASX J11443212+2006238 (right), with levels chosen to highlight the bright part of the emission. Smoothed (by 2.8 arcsec) contours of the Hα-NET image show the low-brightness, extended tail behind 2MASX J11443212+2006238 whose maximum projected length is 85 kpc. North is at the top and east to the left. |
| In the text | |
Current usage metrics show cumulative count of Article Views (full-text article views including HTML views, PDF and ePub downloads, according to the available data) and Abstracts Views on Vision4Press platform.
Data correspond to usage on the plateform after 2015. The current usage metrics is available 48-96 hours after online publication and is updated daily on week days.
Initial download of the metrics may take a while.