Fig. 9
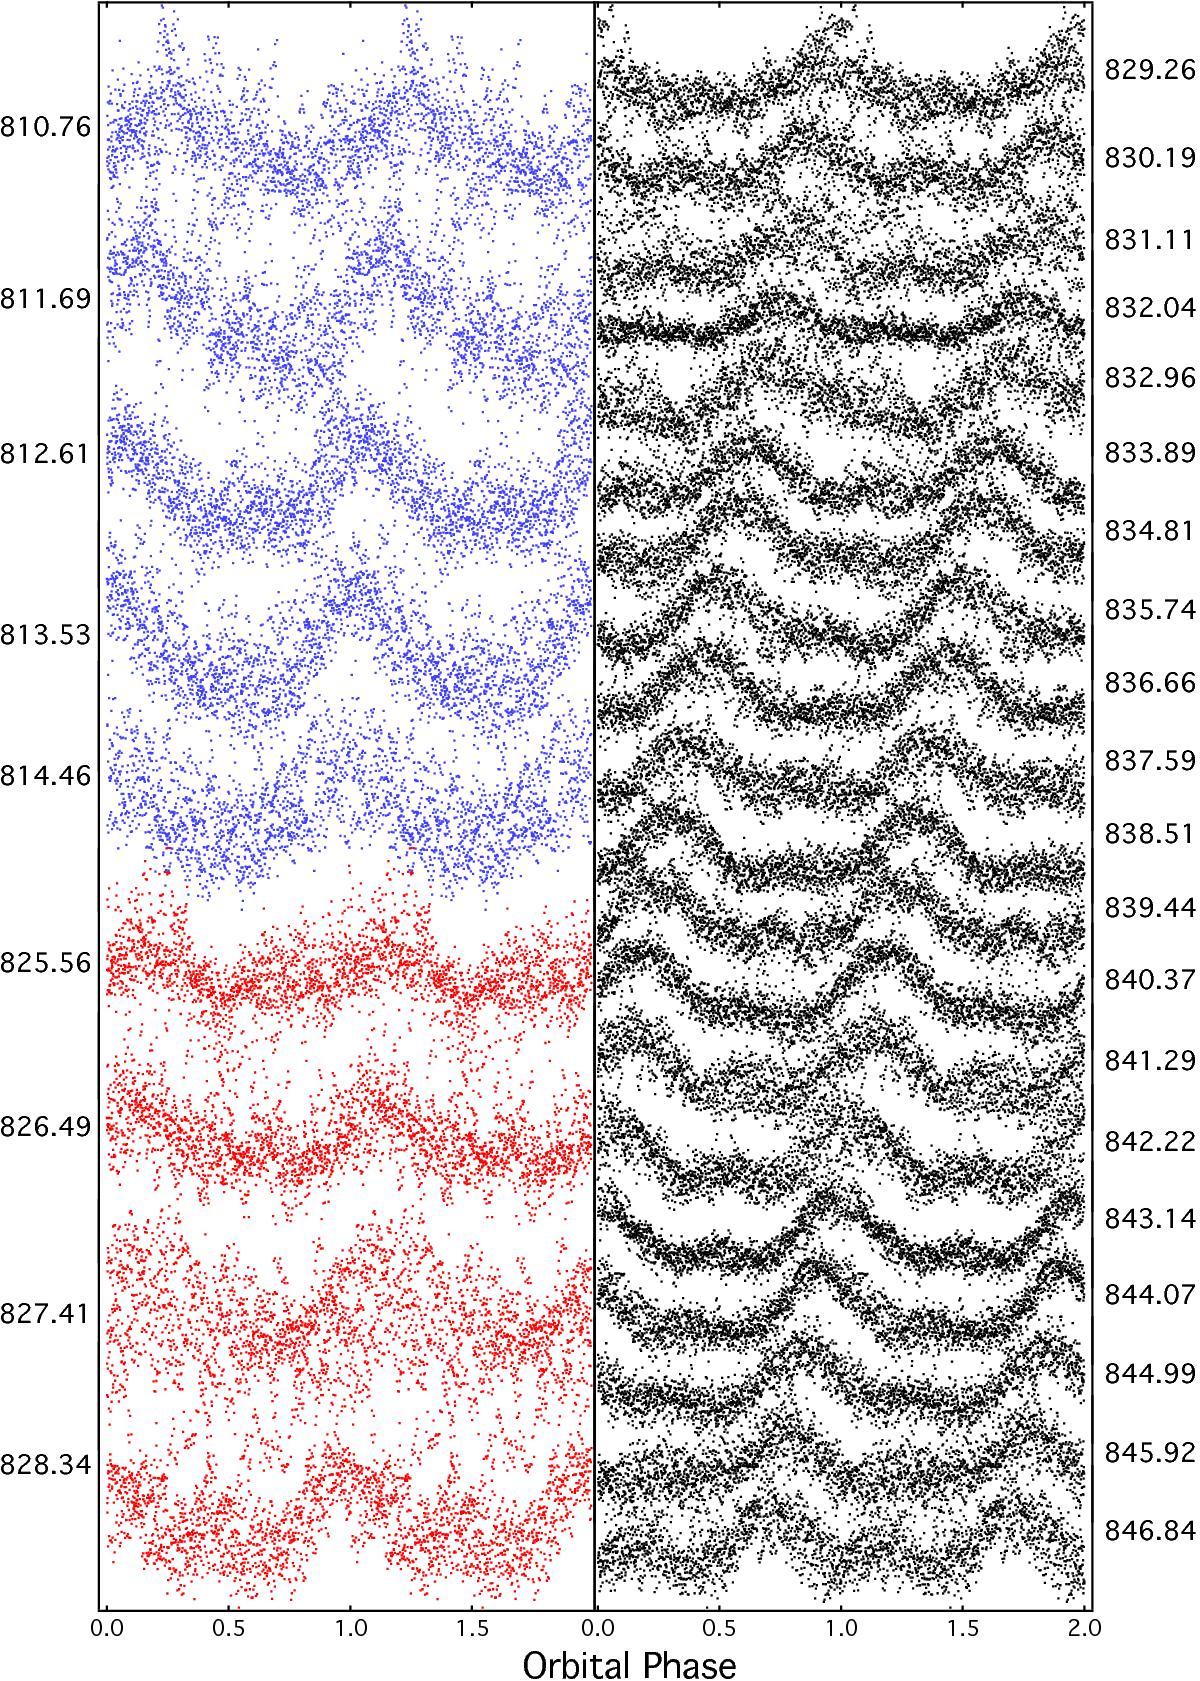
29 phased light curves of TW Vir in quiescence around superoutburst folded on the initial period of 0.185 day and stacked in time order. Like Fig. 5, the median time of each section is labeled on the Y-axis. The blue and black light curves indicate the light curves before and after superoutburst, respectively. The red light curves are derived from the part of light curve between the two vertical dash lines shown in Fig. 7. According to our phase-correcting method, the 20 black light curves with the distinct double-hump modulation and the 4 red light curves were used to improve the orbital period of TW Vir.
Current usage metrics show cumulative count of Article Views (full-text article views including HTML views, PDF and ePub downloads, according to the available data) and Abstracts Views on Vision4Press platform.
Data correspond to usage on the plateform after 2015. The current usage metrics is available 48-96 hours after online publication and is updated daily on week days.
Initial download of the metrics may take a while.