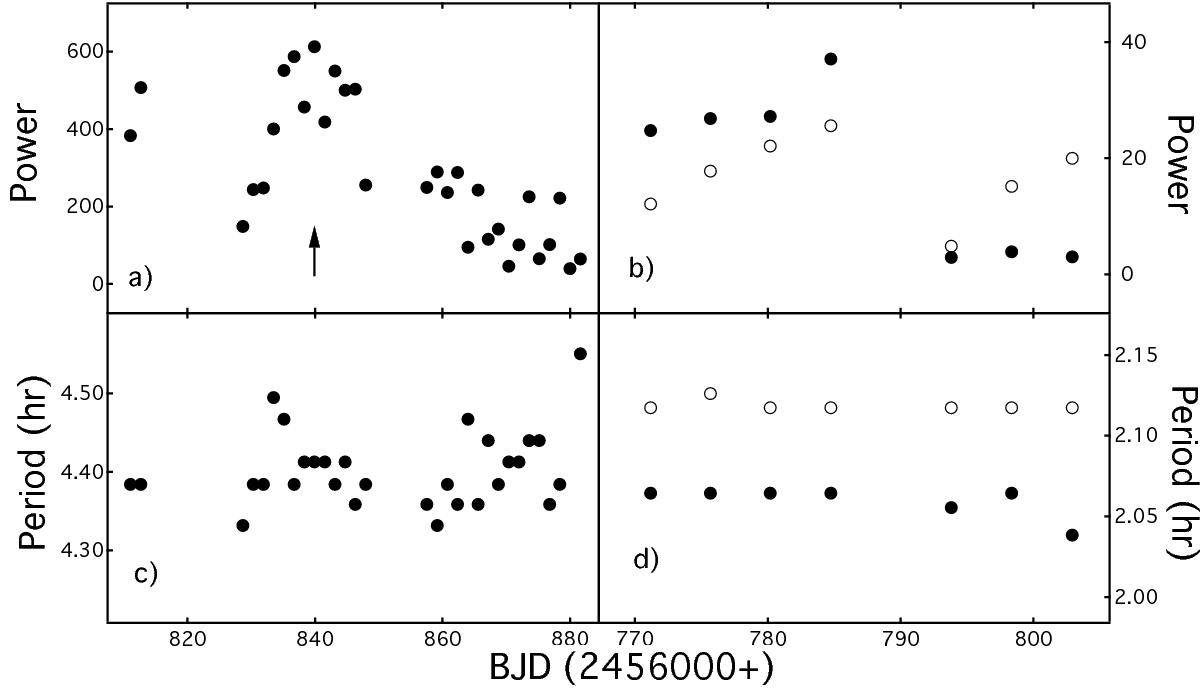
Fig. 8

Maximal power extracted from the 2D power spectrum of TW Vir shown in Fig. 7 and the corresponding periods were plotted in the left-side panels a and c, respectively. Similarly, the two diagrams on the right-side are for UV Gem. The solid and open circles in the plots of UV Gem refer to the orbital and possibly remaining superhump periods after an unrecorded superoutburst (Dai et al. 2015), respectively. The arrow shown in panel a denotes the changing point of the orbital modulation from strong to weak around BJD 2 456 839.9.
Current usage metrics show cumulative count of Article Views (full-text article views including HTML views, PDF and ePub downloads, according to the available data) and Abstracts Views on Vision4Press platform.
Data correspond to usage on the plateform after 2015. The current usage metrics is available 48-96 hours after online publication and is updated daily on week days.
Initial download of the metrics may take a while.


