Fig. 7
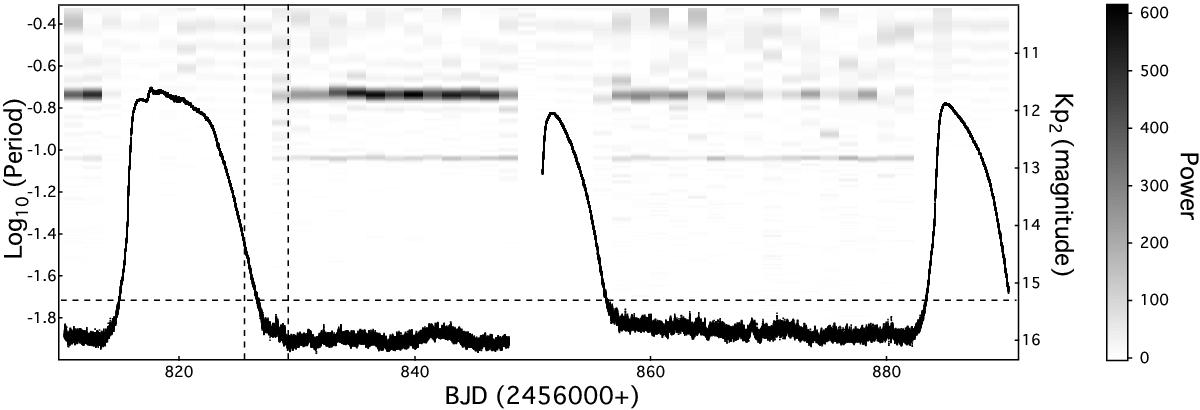
Two-dimensional power spectrum of TW Vir calculated from a moving window 1.6 day is overplotted with its K2 light curve in magnitudes. A horizontal dash line at Kp2 = 15.3 mag is arbitrarily used to distinguish the two luminosity states: outburst and quiescence. The light curve between the two vertical dash lines lasting ~3.7 days may denote the rebuilding process of the orbital modulation that was interrupted by the superoutburst.
Current usage metrics show cumulative count of Article Views (full-text article views including HTML views, PDF and ePub downloads, according to the available data) and Abstracts Views on Vision4Press platform.
Data correspond to usage on the plateform after 2015. The current usage metrics is available 48-96 hours after online publication and is updated daily on week days.
Initial download of the metrics may take a while.