Fig. 2
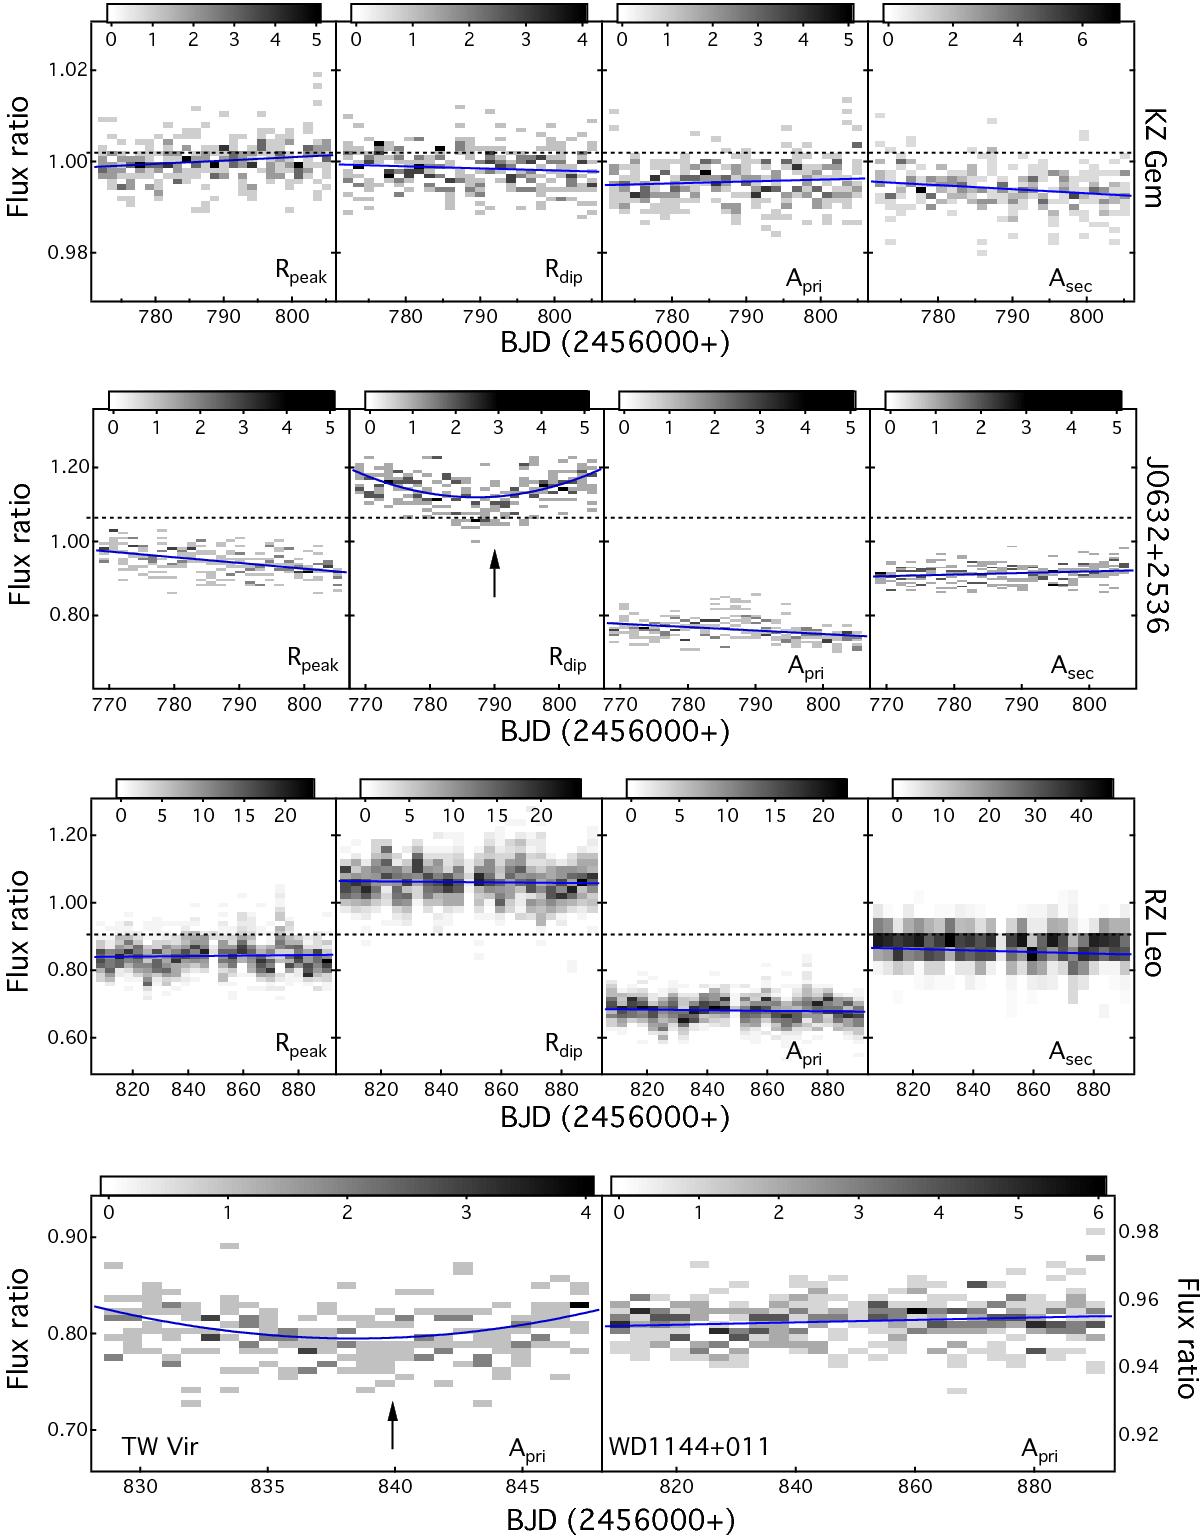
25 × 25 pix colormaps of four flux ratios defined by Eq. (2) for the same object are aligned from top to bottom. The two plots of Apri for TW Vir and WD 1144+011 lie alongside at the bottom, since Apri is the only available parameter for both CVs. The gray scale denotes the number of the flux ratios falling into each grid. The blue solid lines refer to the best-fitting curves, and the average and the corresponding coefficients of flux ratios are listed in Table 2. The arrow shown in Rdip plot of J0632+2536 indicates the transient event of J0632+2536 around BJD 2 456 790. The time pointed by the arrow in Apri plot of TW Vir is the same as that in panel a of Fig. 8.
Current usage metrics show cumulative count of Article Views (full-text article views including HTML views, PDF and ePub downloads, according to the available data) and Abstracts Views on Vision4Press platform.
Data correspond to usage on the plateform after 2015. The current usage metrics is available 48-96 hours after online publication and is updated daily on week days.
Initial download of the metrics may take a while.