Free Access
Fig. 11
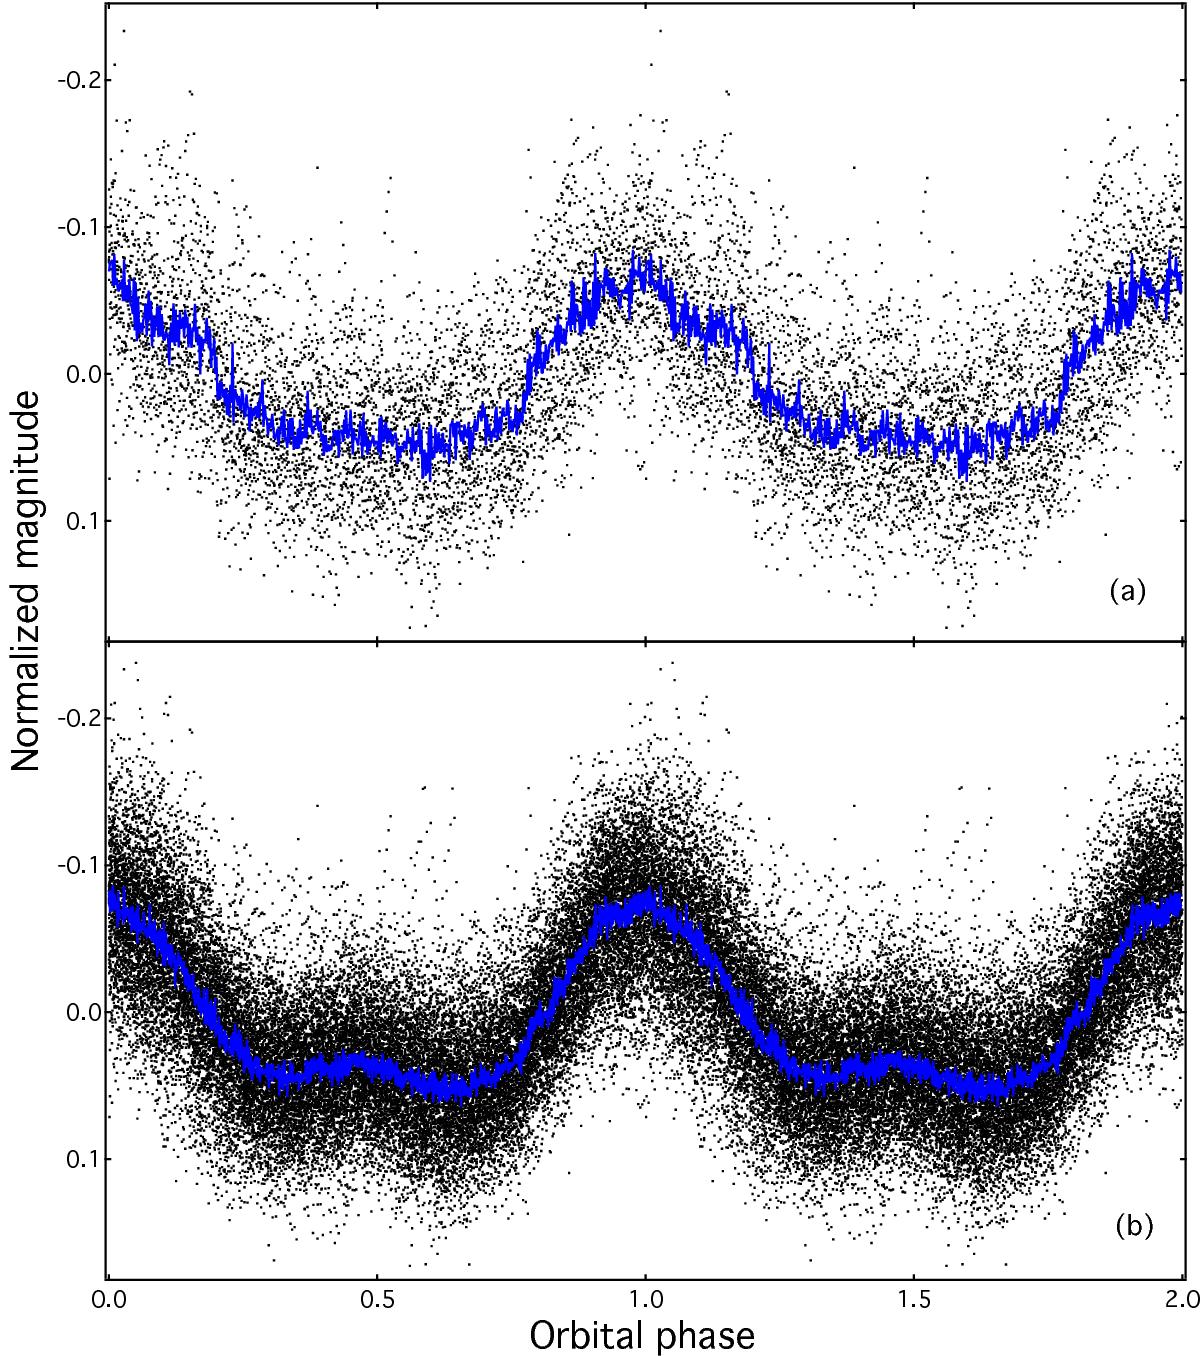
Based on the light curves before and after superoutburst, the phased light curves of TW Vir with the corrected orbital period of 0.182682(3) day show the single-hump and double-hump modulation shown in panels a and b, respectively. The blue solid lines are the binned light curves.
Current usage metrics show cumulative count of Article Views (full-text article views including HTML views, PDF and ePub downloads, according to the available data) and Abstracts Views on Vision4Press platform.
Data correspond to usage on the plateform after 2015. The current usage metrics is available 48-96 hours after online publication and is updated daily on week days.
Initial download of the metrics may take a while.