Free Access
Fig. 3
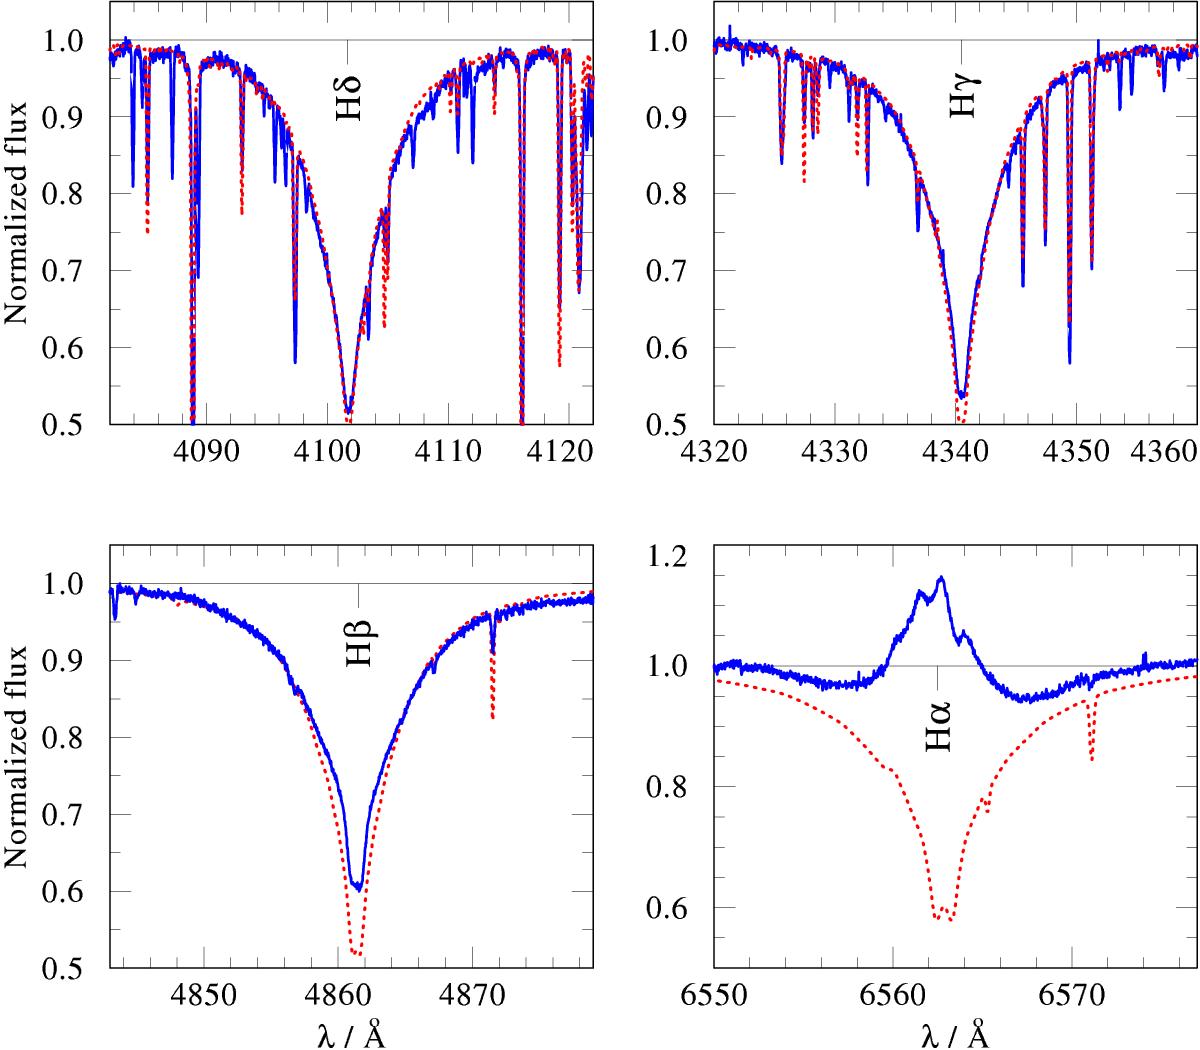
Our best fitting model with parameters as in Table 1 (red dotted line) compared to the first four Balmer lines, as observed in the HARPS spectrum (blue solid line). The disk emission of Hα and Hβ is not included in the model.
Current usage metrics show cumulative count of Article Views (full-text article views including HTML views, PDF and ePub downloads, according to the available data) and Abstracts Views on Vision4Press platform.
Data correspond to usage on the plateform after 2015. The current usage metrics is available 48-96 hours after online publication and is updated daily on week days.
Initial download of the metrics may take a while.