Fig. B.1
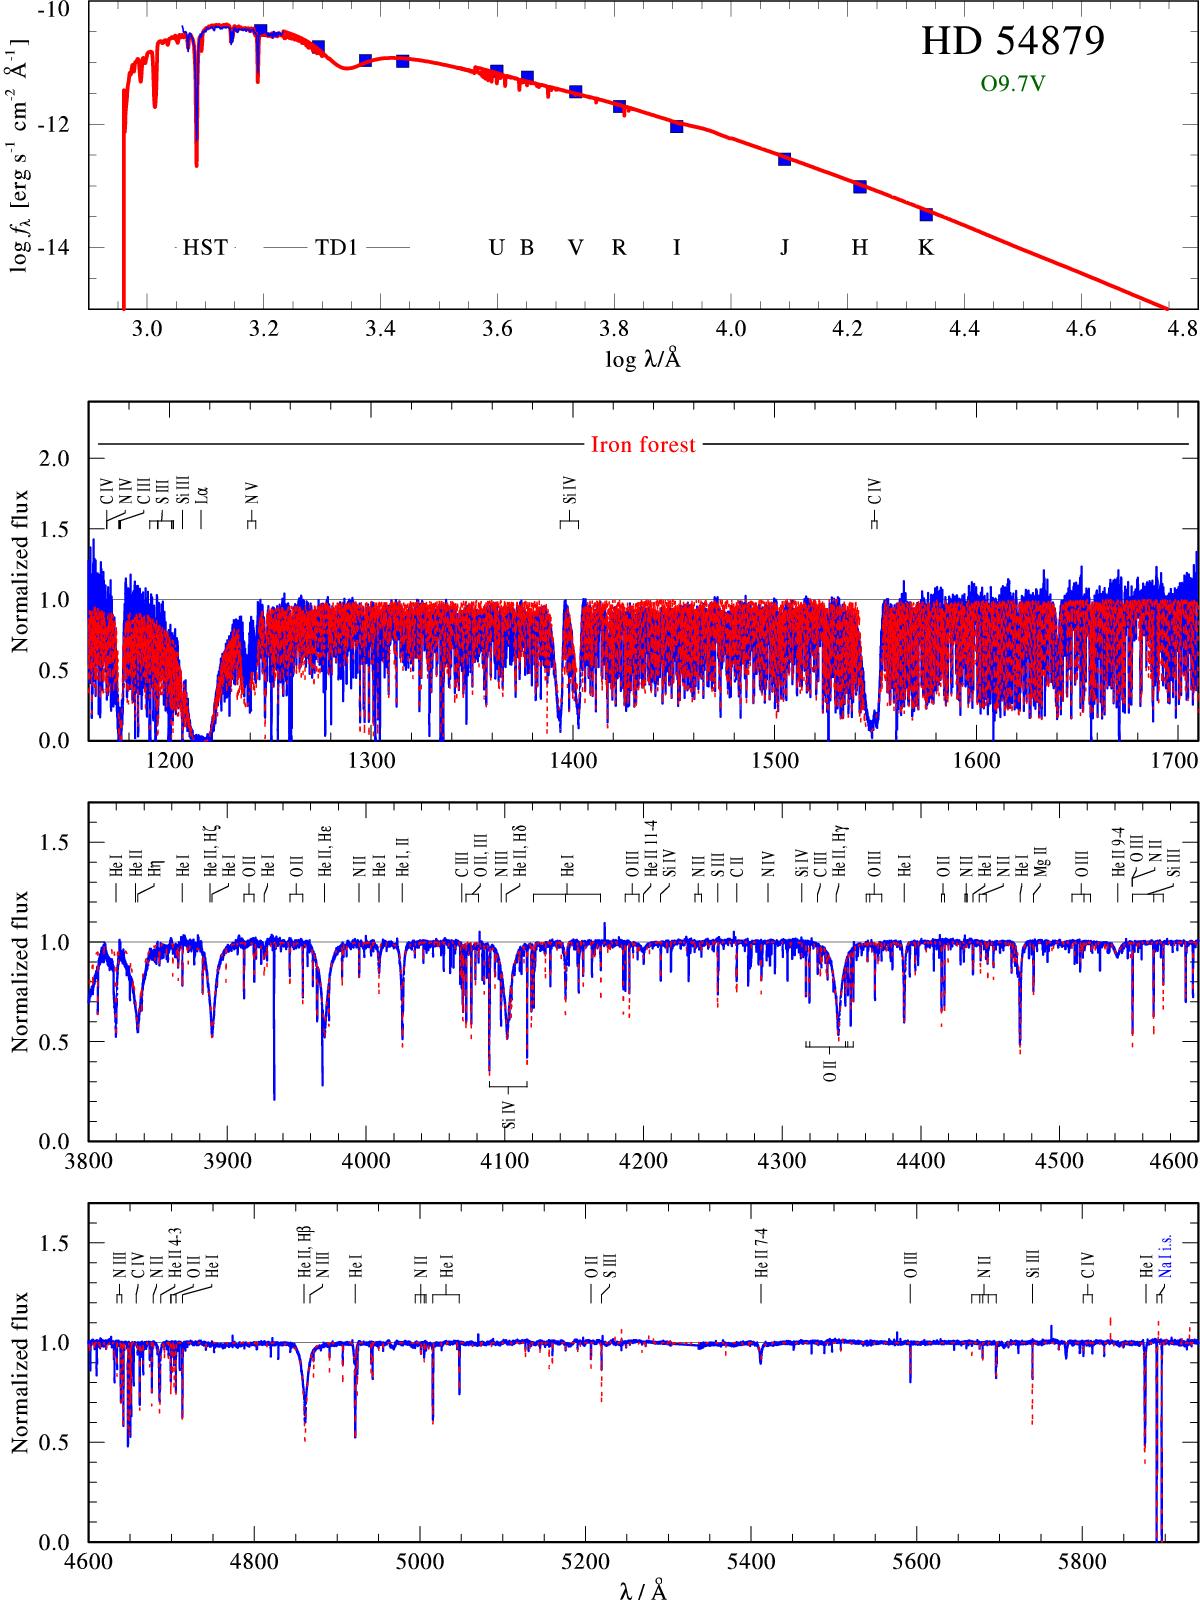
Upper panel: comparison between observed photometry (blue squares) and the flux-calibrated HST spectrum (blue line) with the SED of our best-fitting model (red line). Lower panels: comparison between observed normalized HST and HARPS spectra (blue solid line) and the best-fitting model (red dotted line). Hα is shown separately (see Fig. 3).
Current usage metrics show cumulative count of Article Views (full-text article views including HTML views, PDF and ePub downloads, according to the available data) and Abstracts Views on Vision4Press platform.
Data correspond to usage on the plateform after 2015. The current usage metrics is available 48-96 hours after online publication and is updated daily on week days.
Initial download of the metrics may take a while.