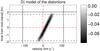
Fig. 3
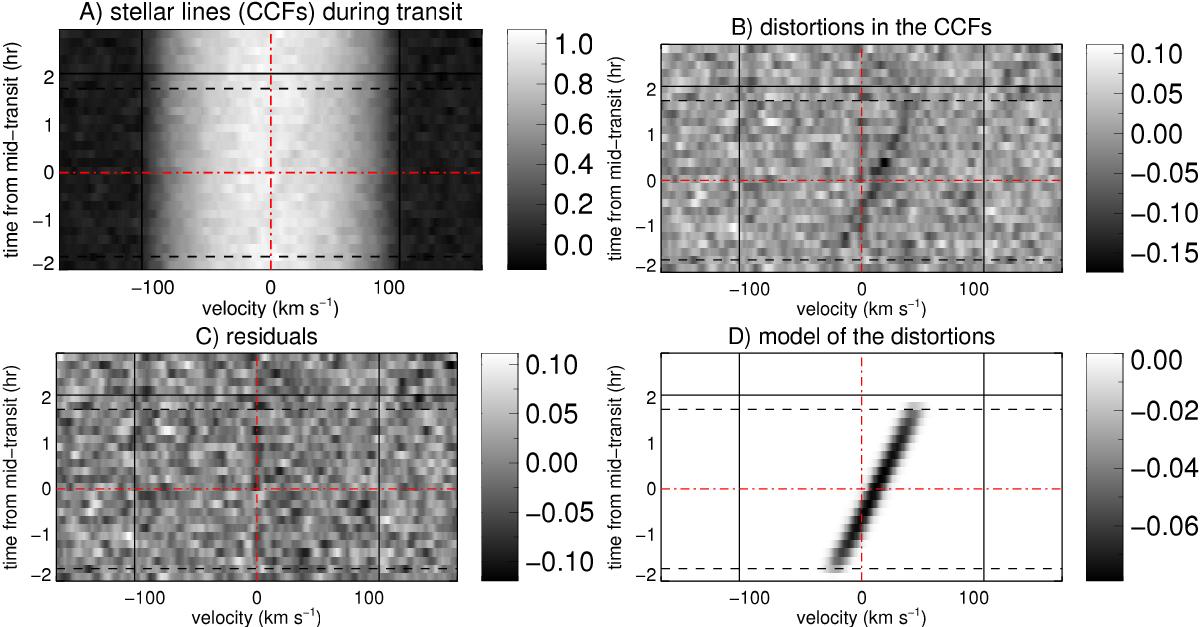
Observations of MASCARA-1 during and after the transit of MASCARA-1 b. In each panel, the solid horizontal line indicates the end of transit and the dashed lines indicate the end of ingress and beginning of egress. The solid black vertical lines show the best-fit value for vsini⋆. The dashed-dotted red lines indicate the mid-transit time and rest-frame velocity of the star. Panel A: the observed CCFs are shown in greyscale. Panel B: the same as in panel A, but with the best-fit model for the undisturbed stellar CCF subtracted, isolating the distortions due to the planetary transit over the rotating stellar photosphere. Panel C: residuals after our best-fitting model, including the planetary transit, is subtracted. Panel D: the corresponding model to the data represented in Panel B is shown.
Current usage metrics show cumulative count of Article Views (full-text article views including HTML views, PDF and ePub downloads, according to the available data) and Abstracts Views on Vision4Press platform.
Data correspond to usage on the plateform after 2015. The current usage metrics is available 48-96 hours after online publication and is updated daily on week days.
Initial download of the metrics may take a while.