Fig. 1
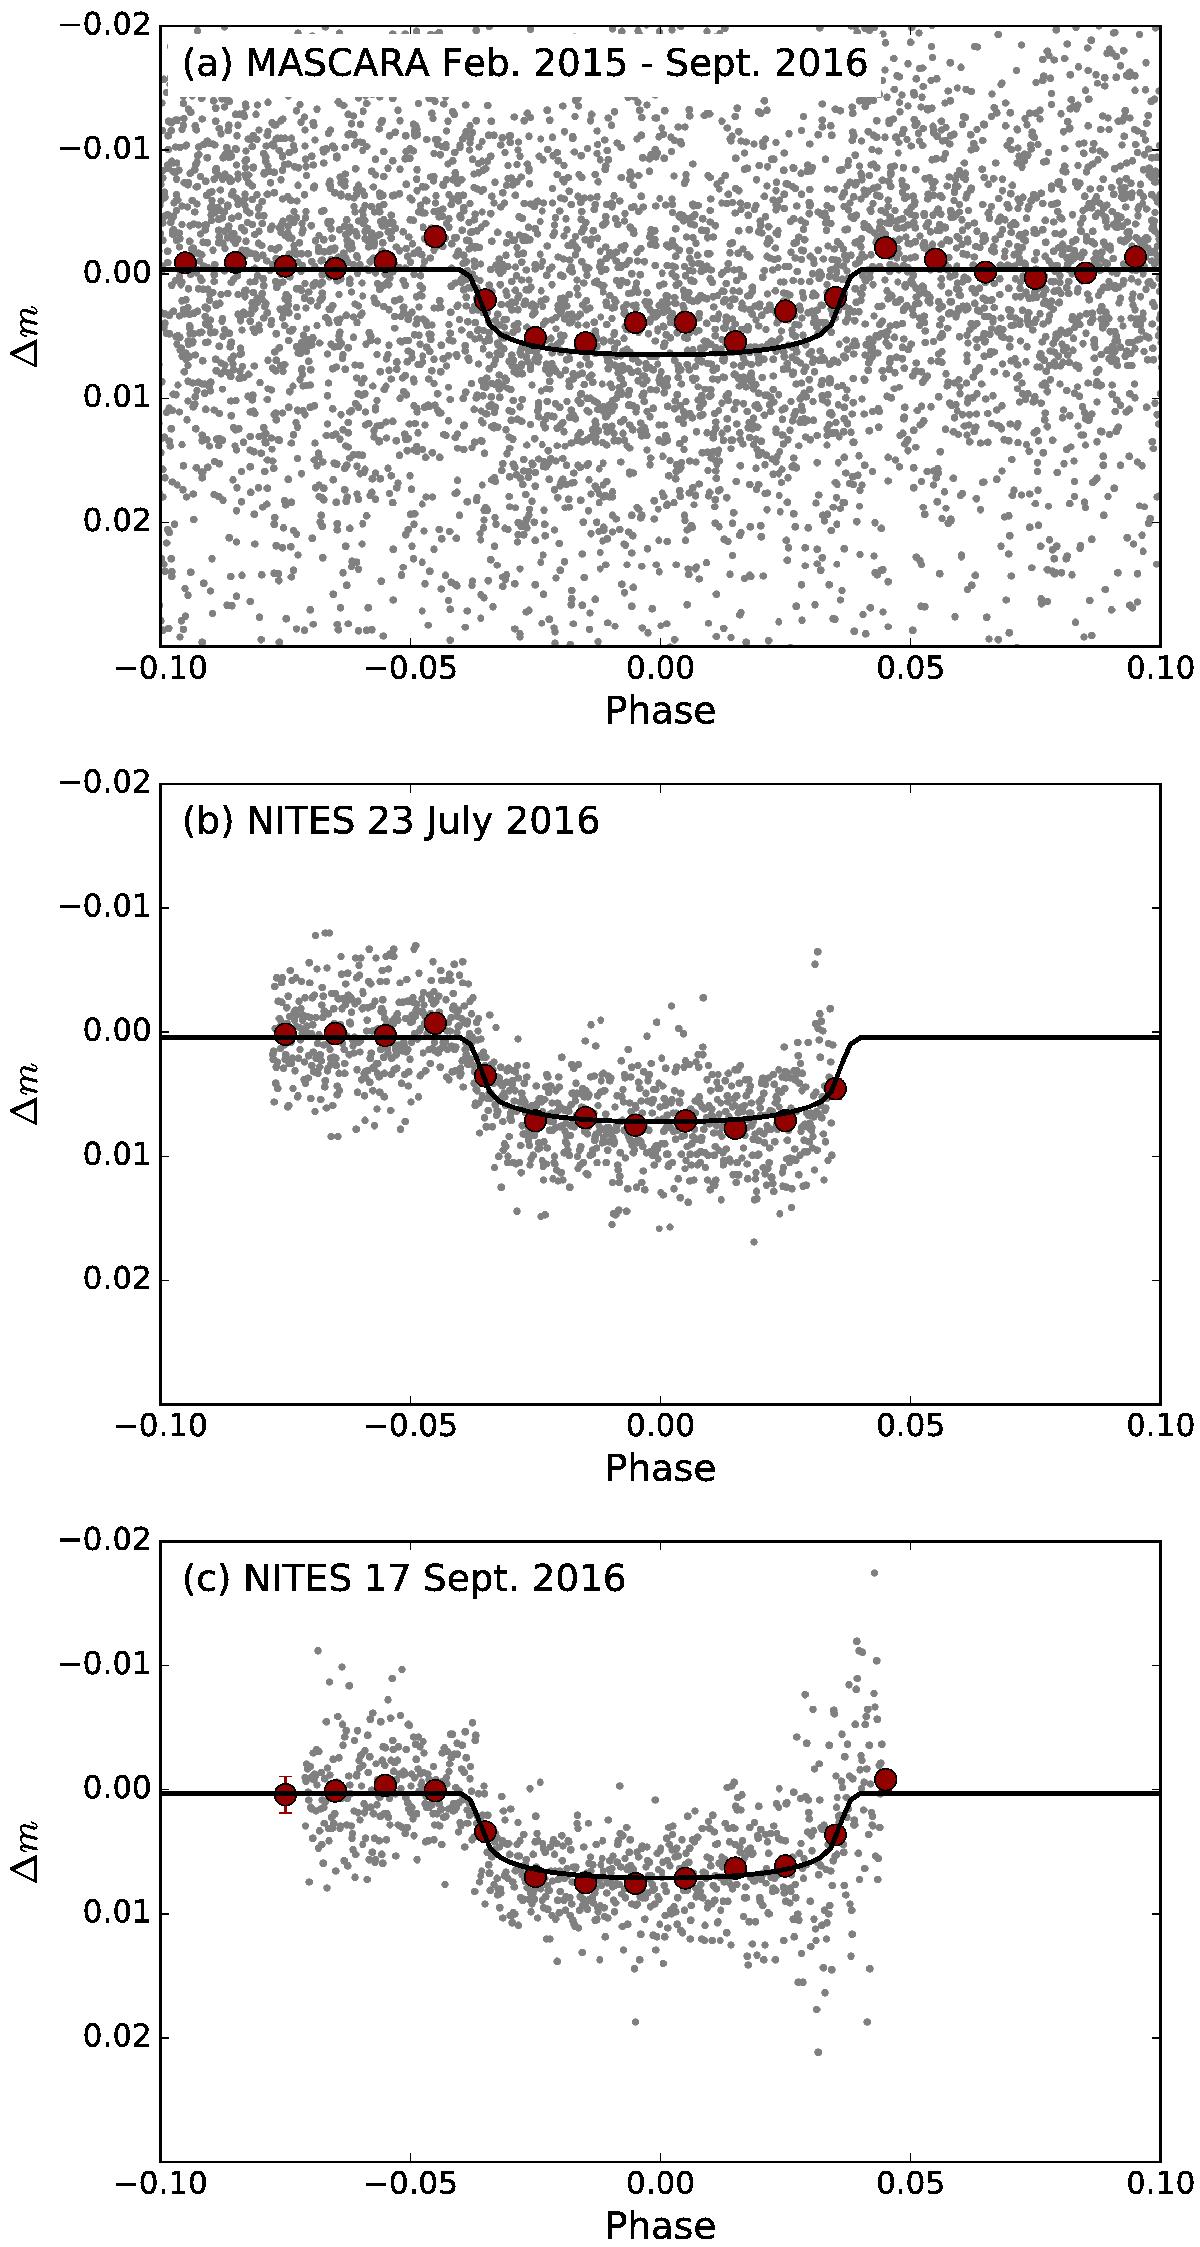
Photometry and best-fit models used in the characterization of MASCARA-1 b. Panel a: MASCARA photometry obtained between February 2015 and September 2016. Shown are the 320 s cadence data (grey points), the data binned by 0.01 in phase (red points), and the best-fit transit model (black line). Panels b and c: NITES transit observations taken on 23 July 2016 and 17 September 2016, respectively. Shown are the data (grey points), the data binned by 0.01 in phase (red points), and the best-fit transit model (black line).
Current usage metrics show cumulative count of Article Views (full-text article views including HTML views, PDF and ePub downloads, according to the available data) and Abstracts Views on Vision4Press platform.
Data correspond to usage on the plateform after 2015. The current usage metrics is available 48-96 hours after online publication and is updated daily on week days.
Initial download of the metrics may take a while.