Fig. 2
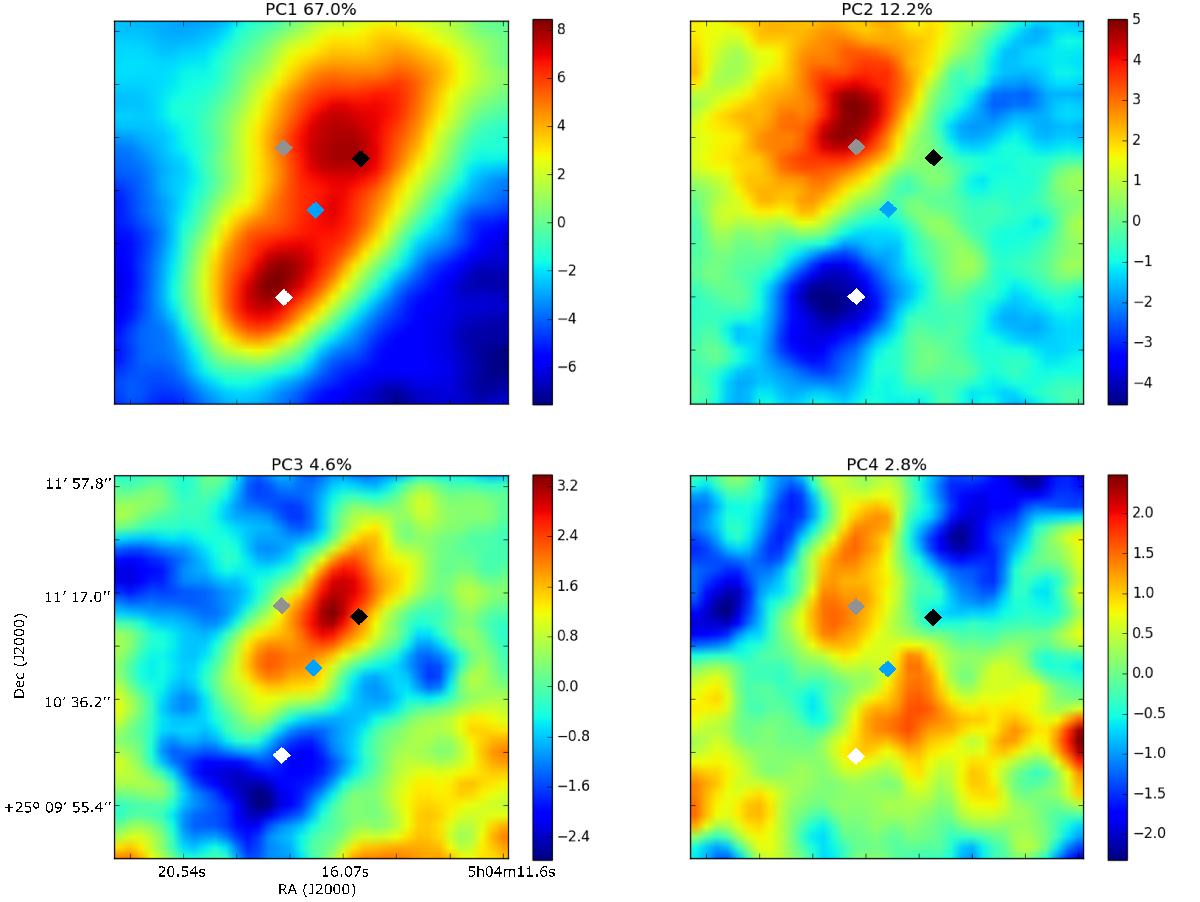
Maps of the first four principal components obtained by performing the PCA on the standardised data. The maps are constructed by summing for each pixel the contribution of each molecular transition scaled by the values reported in Table 2, i.e. they represent each pixel projected in the space of the principal components. The percentages represent the amount of correlation that can be reproduced by the single principal component. The blue, black, white, and grey diamonds indicate the dust, the HNCO, the c-C3H2, and the methanol peaks respectively.
Current usage metrics show cumulative count of Article Views (full-text article views including HTML views, PDF and ePub downloads, according to the available data) and Abstracts Views on Vision4Press platform.
Data correspond to usage on the plateform after 2015. The current usage metrics is available 48-96 hours after online publication and is updated daily on week days.
Initial download of the metrics may take a while.