Fig. 1
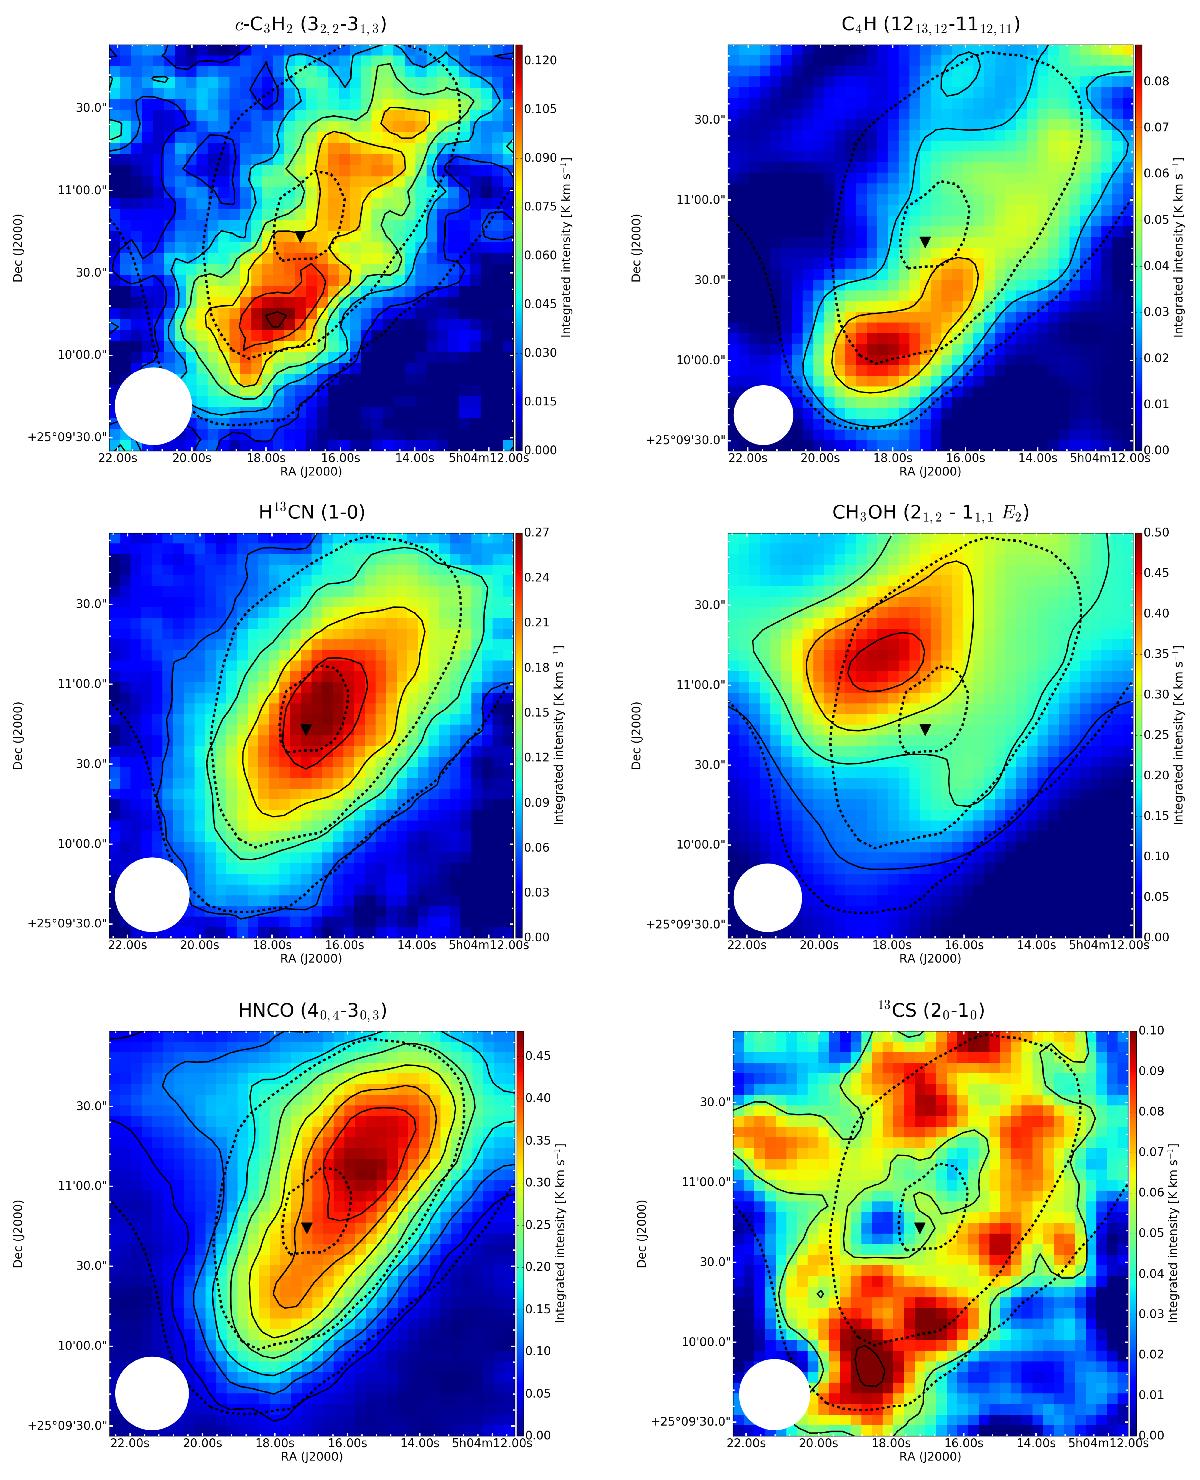
Sample of maps belonging to the different families observed towards L1544. The full dataset is shown in Appendix A. The black dashed lines represent the 90%, 50%, and 30% of the H2 column density peak value derived from Herschel maps (Spezzano et al. 2016b), 2.8 × 1022 cm-2. The solid lines represent contours of the molecular integrated emission starting with 3σ with steps of 3σ (the rms of each map is reported in Table 1). The dust peak (Ward-Thompson et al. 1999) is indicated by the black triangle. The white circles represent the HPBW of the 30 m telescope.
Current usage metrics show cumulative count of Article Views (full-text article views including HTML views, PDF and ePub downloads, according to the available data) and Abstracts Views on Vision4Press platform.
Data correspond to usage on the plateform after 2015. The current usage metrics is available 48-96 hours after online publication and is updated daily on week days.
Initial download of the metrics may take a while.