| Issue |
A&A
Volume 606, October 2017
|
|
|---|---|---|
| Article Number | A21 | |
| Number of page(s) | 13 | |
| Section | Galactic structure, stellar clusters and populations | |
| DOI | https://doi.org/10.1051/0004-6361/201731246 | |
| Published online | 29 September 2017 | |
The real population of star clusters in the bar of the Large Magellanic Cloud⋆
1 Consejo Nacional de Investigaciones Científicas y Técnicas, Av. Rivadavia 1917, C1033AAJ Buenos Aires, Argentina
2 Observatorio Astronómico, Universidad Nacional de Córdoba, Laprida 854, 5000 Córdoba, Argentina
e-mail: andres@oac.unc.edu.ar
Received: 25 May 2017
Accepted: 13 July 2017
We report results on star clusters located in the south-eastern half of the Large Magellanic (LMC) bar from Washington CT1 photometry. Using appropriate kernel density estimators, we detected 73 star cluster candidates, three of which do not show any detectable trace of star cluster sequences in their colour–magnitude diagrams (CMDs). We did not detect the other 38 previously catalogued clusters, which could not be recognized when visually inspecting the C and T1 images either; the distribution of stars in their respective fields do not resemble that of a stellar aggregate. They represent ~33 per cent of all catalogued objects located within the analysed LMC bar field. From matching theoretical isochrones to the cluster CMDs cleaned from field star contamination, we derived ages in the range 7.2 < log(t yr-1) < 10.1. As far as we are aware, this is the first time that homogeneous age estimates based on resolved stellar photometry are obtained for most of the studied clusters. We built the cluster frequency (CF) for the surveyed area, and found that the main star cluster formation activity has taken place during the period log(t yr-1) ~ 8.0–9.0. Since ~100 Myr ago, clusters have been formed during a few bursting formation episodes. When comparing the observed CF to that recovered from the star formation rate, we found noticeable differences, which suggests that field star and star cluster formation histories could have been significantly different.
Key words: techniques: photometric / galaxies: individual: LMC / Magellanic Clouds
Photometric catalogues of the studied star clusters are only available at the CDS via anonymous ftp to cdsarc.u-strasbg.fr (130.79.128.5) or via http://cdsarc.u-strasbg.fr/viz-bin/qcat?J/A+A/606/A21
© ESO, 2017
1. Introduction
Although it is expected that most of the Large Magellanic Cloud (LMC) clusters catalogued by Bica et al. (2008, hereafter B08,) are real extended objects, B08 did not confirm their nature. Because they come from inspection of photographic plates by eye or by automatic codes, we should not rule out that some of them could be asterisms. Piatti & Bica (2012) and Piatti (2014b) found 10–15% of the catalogued objects to be possibly non-physical systems. Cleaning cluster catalogues is not an exciting task. Nayak et al. (2016) have preferred not to study star clusters on the basis of variation in the field star distribution or embedded in fields suffering from large dispersion in the field star count with respect to the average, around the cluster. Here, we study star clusters located in the south-eastern half of the LMC bar near the old globular cluster NGC 1939. Of the regions populated by star clusters in the galaxy, this is one of the most densely populated areas, and most of the clusters have not been studied from resolved stellar photometry so far.
The paper is organized as follows: Sect. 2 describes the data set and the procedures we used to obtain standardized Washington CT1 photometry. We describe the search for star clusters performed from the photometric data set in Sect. 3, while in Sect. 4 we derive cluster ages. The analysis of the derived ages is carried out in Sect. 5, where we introduce the intrinsic cluster formation history for the surveyed region. Finally, Sect. 6 summarizes the main outcomes of this work.
2. Observational data
We took advantage of CT1 Washington images available at the National Optical Astronomy Observatory (NOAO) Science Data Management (SDM) Archives1, which were obtained as part of a survey of the most metal-poor stars outside the Milky Way (CTIO 2008B-0296 programme, PI: Cole). The images analysed here consist of a 420 s C and a 30 s R exposures obtained with the 8K × 8K CCD camera (36′× 36′ field) attached at the 4 m Blanco telescope (CTIO) under photometric conditions (seeing values are between 1.0 and 1.3, with an average of 1.1) and at an airmass of 1.3.
The data sets were fully processed following the procedures extensively described in Piatti et al. (e.g. 2012), Piatti (e.g. 2012, 2015, and references therein), together with the whole data set for the aforementioned CTIO programme, which comprises 17 different LMC fields (see, Fig. 1) and used the mscred package in IRAF2. Point-spread function photometry was obtained by employing the daophot/allstar, daomatch, and daomaster suite of programs3 (Stetson et al. 1990; Piatti et al. 2012; Piatti 2015). The photometric errors were computed as described in Piatti & Bastian (2016), Piatti & Cole (2017). Figure 3 (top left panel) illustrates with error bars at the left margin the typical photometric errors. The 50 per cent completeness level is reached at C~T1≈ 20.0 mag (see e.g. Piatti & Cole 2017).
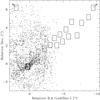 |
Fig. 1 Spatial location of the LMC star field studied here (thick black box), along with the remaining CTIO programme fields. Star clusters catalogued by Bica et al. (2008) are also drawn (dots) for comparison purposes. |
3. Identification of star clusters
We identified star clusters using an upgraded version of the procedure developed in Piatti et al. (2016) that has also been successfully used elsewhere (e.g. Piatti 2016, 2017). We particularly used a cut-off density of 1.5 times the local background dispersion above the mean background value. In our case, we generated a stellar density surface over the studied region from 902 095 stars with positions and magnitudes measured in the two CT1 filters. Here we finally obtained 73 star cluster candidates, all of them included in B08, except for a new cluster candidate centred at (RA, Dec) = (81.̊099754, −69.̊609673) (J2000.0).
We extracted from B08 every object with (RA, Dec) coordinates within the boundaries of the surveyed area in order to check whether the cluster search could pass over any catalogued cluster. We found that 39 catalogued clusters were not identified; one of them ([SL63] 443) because it falls on a Mosaic II image gap. The other 38 objects (see Table 1) could not be recognized when visually inspecting the C and T1 images, since the distribution of stars in their respective fields do not resemble that of an stellar aggregate. We consider them as probable non-genuine star clusters. The analysed crowded region shows high star field density variations that in addition to the particular spatial resolution used and magnitude limit reached by previous cataloguing works, could lead them to infer the existence of extended objects (sometimes not resolved). The catalogue of B08 includes objects discovered by the Optical Gravitational Lens Experiment (Udalski 2003, OGLE III), whose depth is of the order of 1.5 mag shallower than the Magellanic Cloud Photometric Survey (Zaritsky et al. 2004, MCPS), which in turn reaches a limiting magnitude V~ 20 mag (Noël et al. 2009). Our limiting magnitude is T1≈ 22.5 mag (Piatti et al., in prep.). As an example, Fig. 2 compares an enlargement of the R image centred on OGLE-CL LMC 414 to that obtained from the DSS Red one. The version of the figure with all objects listed in Table 1 is available in Appendix B. The 38 probable non-genuine physical systems represent ~33 per cent of all objects located within the analysed LMC bar field, catalogued by B08. This percentage is much higher than the percentages found by Piatti & Bica (2012) and Piatti (2014b) for other Magellanic Cloud regions.
Probable non-genuine objects in the catalogue of B08.
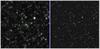 |
Fig. 2 3 × 3 arcmin2 DSS Red (left) and R (right) images centred on OGLE-CL LMC 414, previously catalogued as a cluster and not recovered as such in the present work. North is up and East to the left. The green circle illustrates the angular dimension given in B08. |
4. Star cluster CMD cleaning
We statistically suctracted field stars from the cluster CMDs by applying the procedure developed by Piatti & Bica (2012) that has successfully been used elsewhere (e.g. Piatti 2014b; Piatti et al. 2015b,a; Piatti & Bastian 2016, and references therein). Here we used four star-field CMDs constructed from stars within circles placed to the north, east, south, and west, adjacent to the cluster region, and with areas equal to the circular area (typically with radii 2–3 times the cluster radius) used for the cluster region. As a result, three objects (BSDL 1719, [HS66] 250, and [HS66] 291) – whose cleaned CMDs do not show any detectable trace of star cluster sequences – were discarded.
Figure 3 illustrates the performance of the cleaning procedure for OGLE-CL LMC 377. The 70 individual photometric catalogues for the confirmed clusters are provided in the online version of the journal. The columns of each catalogue successively list the star ID, the RA and Dec, the magnitude and error in C and T1, respectively, and the photometric membership probability (P). The latter is encoded with numbers 1–4 to represent probabilities of 25, 50, 75, and 100 per cent, respectively.
According to Piatti & Geisler (2013, see their Fig. 6), LMC star clusters mostly expand the age range log(t yr-1) ≲ 9.40, with the exception of ESO 121-SC-03 (log(t yr-1) ~ 9.92) and 15 old globular clusters (log(t yr-1) ~ 10.1). Young star clusters are distinguished in the CMDs by their bright MSs, while intermediate-age clusters (9 < log(t yr-1) < 9.45) have MS turnoffs (TOs) that decrease in brightness as they become older. A typical 2.5 Gyr old LMC cluster (log(t yr-1) = 9.4) has its MS TO at T1~ 20.5 mag. By assuming a depth of the LMC disc of (3.44 ± 1.16) kpc (Subramanian & Subramaniam 2009) and that such a cluster is located behind the LMC, its MS TO would result ΔT1≲ 0.3 mag fainter. This means that the faintest cluster MS TO stars typically seen in the LMC are brighter than T1≈ 21.0 mag. This magnitude is even brighter that our limiting magnitude, so that we were able to detect any star cluster (with stars from its brightest limit down to its MS TO) located in the surveyed field.
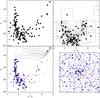 |
Fig. 3 CMDs for stars in the field of OGLE-CL LMC 377: the observed CMD composed of the stars distributed within the cluster radius, with typical photometric errors represented with error bars at the left margin (top left-hand panel); a field CMD for a circular area equal to that of the cluster with the respective sample of produced boxes used in the cleaning procedure (top right-hand panel); the cleaned cluster CMD (bottom left). Colour-scaled symbols represent stars with membership probability of P≤ 25% (pink), P= 50% (light blue), and P≥ 75% (dark blue). Three isochrones from Bressan et al. (2012) for log(t yr-1) = 8.1, 8.2, and 8.3 and Z = 0.006 are also superimposed. The schematic diagram centred on the cluster is shown in the bottom right-hand panel. The black circle represents the adopted cluster radius. Symbols are as in the bottom left-hand panel, with sizes proportional to the stellar brightnesses. North is up; east is to the left. The actual images are shown in Fig. A.1. |
5. Star cluster ages
We estimated the ages of the confirmed star clusters using their CMDs built from stars with membership probabilities higher than 50 per cent and matching them with the theoretical isochrones of Bressan et al. (2012). In performing this task, we dealt with their reddenings, distances, and metallicities. As for the cluster metallicies, we adopted a value of [Fe/H] = −0.4 dex for all of them (Piatti & Geisler 2013). Consequently, if we were allow the metallicity to vary, we would not be able to see any meaningful difference along the cluster MSs because of the dispersion of the stars. We made one exception in the employment of isochrones for the old globular cluster NGC 1939, for which we adopted [Fe/H] = −2.0 dex.
We took advantage of the Magellanic Clouds (MCs) extinction values based on red clump (RC) and RR Lyrae stellar photometry provided by the OGLE III collaboration, as described in Haschke et al. (2011), to estimate E(V−I) colour excesses. We recall that they found very low reddenings in the LMC bar region. In matching isochrones, we started by adopting those E(V−I) values, combined with the equations E(V−I)/E(B−V) = 1.25, AV/E(B−V) = 3.1 (Cardelli et al. 1989); E(C−T1)/E(B−V) = 1.97 and AT1/E(B−V) = 2.62 (Geisler 1996). We note that considering the LMC disc depth, the difference in distance modulus could be as large as Δ(m−M)o~ 0.3 mag, which is of the order of the uncertainties while adjusting isochrones to the cluster CMDs in magnitude (nearly twice as large as the size of the plotting symbols in Fig. 3), so that our simple assumption of adopting the same distance of all clusters should not affect the results.
Table 2 lists the derived E(V−I) colour excesses and ages, while Fig. 3 (bottom left panel) illustrates the performance of the isochrone matching. We estimated an upper value for our age uncertainties of Δlog(t yr-1) = ±0.10.
Fundamental properties of the star cluster sample.
6. Star cluster analysis
Only few clusters in our sample have previously been studied from resolved stellar photometry. Mackey & Gilmore (2004) presented HST data that resulted in high-accuracy CMDs for NGC 1938 and NGC 1939. Our CT1 photometry confirms their results for the old globular cluster NGC 1939 (log(t yr-1) = 10.1, [Fe/H] = −2.0 dex) and gives an age slightly older than and within the quoted uncertainties of the value derived by them (log(t yr-1) ~ 8.6) for NGC 1938. Dieball & Grebel (2000) obtained Gunn g,i photometry at the ESO/MPI 2.2 m telescope (La Silla) for the triple system NGC 1969, 1971, and 1972, and derived ages of log(t yr-1) = 7.8, 7.8, and 7.6 with a typical error of σ(log(t yr-1)) = ±0.1, respectively, from the matching of theoretical isochrones. These values are younger than those derived here, and could be mostly affected by star field contamination; particularly of bright field stars assumed to be cluster stars (see their Fig. 7). We note that they did not perform any decontamination of field stars in their CMDs.
The VISTA4 near-infrared YJKs survey of the MCs system (Cioni et al. 2011, VMC) has also imaged three clusters of our sample, namely KMK88 55, OGLE-CL LMC 451 (≡[HS66] 282), and OGLE-CL LMC 469 (≡[HS66] 295). They were studied by Piatti et al. (2014) from CMDs built using PSF photometry on homogenised deep tile images (Rubele et al. 2012). KMK88 55 was found to be a cluster of log(t yr-1) ~ 8.5, while OGLE-CL LMC 451 and OGLE-CL LMC 469 were classified as probable non-genuine star clusters. The older age derived for KMK88 55 is affected by the lack of measurements of blue cluster stars, while the assessment of the physical reality of OGLE-CL LMC 451 and OGLE-CL LMC 469 is based on a shallower VMC Ks limiting magnitude. We show in Fig. 4 the cleaned CMDs constructed by Piatti et al. (2014) compared to ours.
Most of the remaining clusters in our sample, as well as those probable non-genuine clusters of Table 1, do have only age estimates on the basis of integrated colours (Pandey et al. 2010; Popescu et al. 2012). However, Asa’d et al. (2013) showed that unresolved methods (integrated broad-band colour photometry) poorly match the ages of LMC clusters derived from resolved stellar photometry (CMD). Piatti (2014a) also found results similar to those of Asa’d et al. (2013) when integrated spectroscopy was used to estimate cluster ages.
The star cluster frequency (CF) – the number of clusters per time unit as a function of age – is a straightforward way to compare the cluster formation activity in different epochs of the galaxy lifetime. In the case of the LMC, it has been built for different regions and been found to vary from one place to another (Piatti 2014b,c,and references therein). Moreover, variations within the LMC bar have also been found (e.g. Piatti et al. 2015a). Therefore, aiming at tracing the intrinsic cluster formation history in the surveyed area, we built its CF from the ages estimated for the 70 studied star clusters.
Instead of constructing an age histogram, we assigned to each cluster a Gaussian distribution centred on the mean cluster age and with FWHM twice as large as the age uncertainty. The result of summing the contribution of all Gaussian distributions is depicted in Fig. 5. For comparison purposes, the CF was normalized to the total number of clusters. As can be seen, the main star cluster formation activity has taken place during the period log(t yr-1) ~ 8.0–9.0, suggesting that either clusters in this bar region have been formed relatively recently, or any cluster older than log(t yr-1) ~ 9 has been disrupted. The only exception is the old globular cluster NGC 1939, which could also be an outer disc cluster projected on the LMC bar (Sharma et al. 2010). Nevertheless, since Piatti (2014c) found for the whole LMC bar that there has been cluster formation activity from log(t yr-1) ~ 9.4, we conclude that this part of the bar is on average a relatively particular younger one. The cluster formation during the last ~100 Myr shows some short isolated periods of true activity.
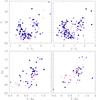 |
Fig. 4 Cleaned CMDs for OGLE-CL LMC 451 (left) and OGLE-CL LMC 469 (right) in the Washington CT1 (top) and YKs (bottom) filters. |
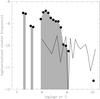 |
Fig. 5 CF of the surveyed region in the LMC bar (filled circles). The grey areas highlight the periods of star cluster formation activity, while the solid line represents the CF recovered from the corresponding SFR obtained by Smecker-Hane et al. (2002). |
The derived CF was finally compared with the CF obtained from the star formation rate (SFR) derived by Smecker-Hane et al. (2002) using HST observations. We used their SFR and cluster masses from log (Mcl [M⊙] ) = 2.2 to log (Mcl [M⊙] ) = 5.0 (de Grijs & Goodwin 2008; Glatt et al. 2011). Figure 5 shows the resulting recovered CF drawn with a solid line. The observed and recovered CFs are clearly different for several reasons. On the one hand, the recovered CF shows star formation activity where there is no cluster (log(t yr-1) ≳ 9.0). At first glance, this could be somewhat surprising when we take into account the common notion that most of the stars more massive than 0.5 0.5 M⊙ may form in clusters, so that a significant fraction of field stellar populations originate from disrupted clusters (e.g. Lada & Lada 2003). However, the LMC exhibits a well-known gap in the cluster age distribution between log(t yr-1) ~ 9.5–10.1, while the age distribution of the field stellar population appears more continuous (Piatti & Geisler 2013). Furthermore, numerous authors have asserted that the LMC’s field star and star cluster formation histories are significantly different (e.g. Olszewski et al. 1996; Geha et al. 1998; Sarajedini 1998, and references therein).
On the other hand, the observed CF shows a noticeable excess with respect to the recovered CF for ages younger than log(t yr-1) ~ 9.0. Even though the recovered CF requires additional refinements, the observed disparities between the cluster and field star age distributions seem to offer evidence in support of a decoupling between star cluster and field star formation. These results provide some clues for a better approach in the study of the field stars origin and its link to cluster disruption and environmental conditions.
7. Conclusions
In this work we analyse CMDs of star clusters located in the South–Eastern half of the LMC bar from a Washington CT1 photometric data set.
We performed a procedure for the star cluster search which consists in using Gaussian and tophat KDEs with a bandwidth of 0.4 arcmin, and detected 73 star cluster candidates. We did not detect other 38 previously catalogued clusters, which could not be recognized when visually inspecting the C and T1 images either. The distribution of stars in their respective fields do not resemble that of an stellar aggregate. We consider them as probable non-genuine star clusters. The 38 probable non-genuine physical systems represent ~33 per cent of all catalogued objects located within the analysed LMC bar field.
The CMDs of the star cluster candidates were statistically cleaned from field star contamination. Three objects, whose CMDs do not show any detectable trace of star cluster sequences, were discarded. The confirmed clusters comprises a complete sample, since we were able to detect any star cluster with stars from its brightest limit down to its MS TO located in the surveyed field. From matching theoretical isochrones to the cleaned cluster CMDs we estimated ages taking into account the LMC mean distance modulus, the present day metallicity and the individual star cluster colour excesses. As far as we are aware, these are the first age estimates based on resolved stellar photometry for most of the studied 70 clusters. The derived ages are in the age range 7.2 < log(t yr-1) < 9.1, in addition to the old globular cluster NGC 1939.
Finally, we built the CF aiming at tracing the intrinsic cluster formation history of the surveyed area. We found that the major star cluster formation activity has taken place during the period log(t yr-1) ~ 8.0–9.0, which results in average relatively younger than the whole formation period of the LMC bar. Since ~100 Myr ago, clusters have been formed during few bursting formation events. When comparing the observed CF to that recovered from the SFR derived by Smecker-Hane et al. (2002) we found noticeable differences. We conclude that they are evidence of field star and star cluster formation histories are significantly different.
Acknowledgments
We thank the referee for his thorough reading of the manuscript and timely suggestions to improve it.
References
- Asa’d, R. S., Hanson, M. M., & Ahumada, A. V. 2013, PASP, 125, 1304 [NASA ADS] [CrossRef] [Google Scholar]
- Bica, E., Bonatto, C., Dutra, C. M., & Santos, J. F. C. 2008, MNRAS, 389, 678 [NASA ADS] [CrossRef] [Google Scholar]
- Bressan, A., Marigo, P., Girardi, L., et al. 2012, MNRAS, 427, 127 [NASA ADS] [CrossRef] [Google Scholar]
- Cardelli, J. A., Clayton, G. C., & Mathis, J. S. 1989, ApJ, 345, 245 [NASA ADS] [CrossRef] [Google Scholar]
- Cioni, M.-R. L., Clementini, G., Girardi, L., et al. 2011, A&A, 527, A116 [NASA ADS] [CrossRef] [EDP Sciences] [Google Scholar]
- de Grijs, R., & Goodwin, S. P. 2008, MNRAS, 383, 1000 [NASA ADS] [CrossRef] [Google Scholar]
- Dieball, A., & Grebel, E. K. 2000, A&A, 358, 897 [NASA ADS] [Google Scholar]
- Geha, M. C., Holtzman, J. A., Mould, J. R., et al. 1998, AJ, 115, 1045 [NASA ADS] [CrossRef] [Google Scholar]
- Geisler, D. 1996, AJ, 111, 480 [NASA ADS] [CrossRef] [Google Scholar]
- Glatt, K., Grebel, E. K., Jordi, K., et al. 2011, AJ, 142, 36 [NASA ADS] [CrossRef] [Google Scholar]
- Haschke, R., Grebel, E. K., & Duffau, S. 2011, AJ, 141, 158 [NASA ADS] [CrossRef] [Google Scholar]
- Lada, C. J., & Lada, E. A. 2003, ARA&A, 41, 57 [NASA ADS] [CrossRef] [Google Scholar]
- Mackey, A. D., & Gilmore, G. F. 2004, MNRAS, 352, 153 [NASA ADS] [CrossRef] [Google Scholar]
- Nayak, P. K., Subramaniam, A., Choudhury, S., Indu, G., & Sagar, R. 2016, MNRAS, 463, 1446 [NASA ADS] [CrossRef] [Google Scholar]
- Noël, N. E. D., Aparicio, A., Gallart, C., et al. 2009, ApJ, 705, 1260 [NASA ADS] [CrossRef] [Google Scholar]
- Olszewski, E. W., Suntzeff, N. B., & Mateo, M. 1996, ARA&A, 34, 511 [NASA ADS] [CrossRef] [Google Scholar]
- Pandey, A. K., Sandhu, T. S., Sagar, R., & Battinelli, P. 2010, MNRAS, 403, 1491 [NASA ADS] [CrossRef] [Google Scholar]
- Piatti, A. E. 2012, MNRAS, 422, 1109 [NASA ADS] [CrossRef] [Google Scholar]
- Piatti, A. E. 2014a, MNRAS, 445, 2302 [NASA ADS] [CrossRef] [Google Scholar]
- Piatti, A. E. 2014b, MNRAS, 440, 3091 [NASA ADS] [CrossRef] [Google Scholar]
- Piatti, A. E. 2014c, MNRAS, 437, 1646 [NASA ADS] [CrossRef] [Google Scholar]
- Piatti, A. E. 2015, MNRAS, 451, 3219 [NASA ADS] [CrossRef] [Google Scholar]
- Piatti, A. E. 2016, MNRAS, 459, L61 [NASA ADS] [CrossRef] [Google Scholar]
- Piatti, A. E. 2017, ApJ, 834, L14 [NASA ADS] [CrossRef] [Google Scholar]
- Piatti, A. E., & Bastian, N. 2016, A&A, 590, A50 [NASA ADS] [CrossRef] [EDP Sciences] [Google Scholar]
- Piatti, A. E., & Bica, E. 2012, MNRAS, 425, 3085 [NASA ADS] [CrossRef] [Google Scholar]
- Piatti, A. E., & Cole, A. 2017, MNRAS, 470, L77 [NASA ADS] [CrossRef] [Google Scholar]
- Piatti, A. E., & Geisler, D. 2013, AJ, 145, 17 [NASA ADS] [CrossRef] [Google Scholar]
- Piatti, A. E., Geisler, D., & Mateluna, R. 2012, AJ, 144, 100 [NASA ADS] [CrossRef] [Google Scholar]
- Piatti, A. E., Guandalini, R., Ivanov, V. D., et al. 2014, A&A, 570, A74 [NASA ADS] [CrossRef] [EDP Sciences] [Google Scholar]
- Piatti, A. E., de Grijs, R., Ripepi, V., et al. 2015a, MNRAS, 454, 839 [NASA ADS] [CrossRef] [Google Scholar]
- Piatti, A. E., de Grijs, R., Rubele, S., et al. 2015b, MNRAS, 450, 552 [NASA ADS] [CrossRef] [Google Scholar]
- Piatti, A. E., Ivanov, V. D., Rubele, S., et al. 2016, MNRAS, 460, 383 [NASA ADS] [CrossRef] [Google Scholar]
- Popescu, B., Hanson, M. M., & Elmegreen, B. G. 2012, ApJ, 751, 122 [NASA ADS] [CrossRef] [Google Scholar]
- Rubele, S., Kerber, L., Girardi, L., et al. 2012, A&A, 537, A106 [NASA ADS] [CrossRef] [EDP Sciences] [Google Scholar]
- Sarajedini, A. 1998, AJ, 116, 738 [NASA ADS] [CrossRef] [Google Scholar]
- Sharma, S., Borissova, J., Kurtev, R., Ivanov, V. D., & Geisler, D. 2010, AJ, 139, 878 [NASA ADS] [CrossRef] [Google Scholar]
- Smecker-Hane, T. A., Cole, A. A., Gallagher, III, J. S., & Stetson, P. B. 2002, ApJ, 572, 1083 [NASA ADS] [CrossRef] [Google Scholar]
- Stetson, P. B., Davis, L. E., & Crabtree, D. R. 1990, in CCDs in astronomy, ed. G. H. Jacoby, ASP Conf. Ser., 8, 289 [NASA ADS] [Google Scholar]
- Subramanian, S., & Subramaniam, A. 2009, A&A, 496, 399 [NASA ADS] [CrossRef] [EDP Sciences] [Google Scholar]
- Udalski, A. 2003, Acta Astron., 53, 291 [NASA ADS] [Google Scholar]
- Zaritsky, D., Harris, J., Thompson, I. B., & Grebel, E. K. 2004, AJ, 128, 1606 [NASA ADS] [CrossRef] [Google Scholar]
Appendix A: OGLE-CL LMC 377 images
Appendix B: Figure 2 (full version)
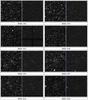 |
Fig. B.1 3×3 arcmin2 DSS Red (left) and R (right) images centred on objects catalogued by B08 (see text for details). North is up and East to the left. The green circle illustrates the angular dimension given in B08. |
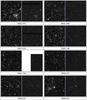 |
Fig. B.1 continued. |
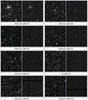 |
Fig. B.1 continued. |
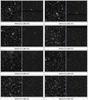 |
Fig. B.1 continued. |
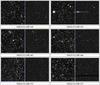 |
Fig. B.1 continued. |
All Tables
All Figures
|
Fig. 1 Spatial location of the LMC star field studied here (thick black box), along with the remaining CTIO programme fields. Star clusters catalogued by Bica et al. (2008) are also drawn (dots) for comparison purposes. |
| In the text | |
|
Fig. 2 3 × 3 arcmin2 DSS Red (left) and R (right) images centred on OGLE-CL LMC 414, previously catalogued as a cluster and not recovered as such in the present work. North is up and East to the left. The green circle illustrates the angular dimension given in B08. |
| In the text | |
|
Fig. 3 CMDs for stars in the field of OGLE-CL LMC 377: the observed CMD composed of the stars distributed within the cluster radius, with typical photometric errors represented with error bars at the left margin (top left-hand panel); a field CMD for a circular area equal to that of the cluster with the respective sample of produced boxes used in the cleaning procedure (top right-hand panel); the cleaned cluster CMD (bottom left). Colour-scaled symbols represent stars with membership probability of P≤ 25% (pink), P= 50% (light blue), and P≥ 75% (dark blue). Three isochrones from Bressan et al. (2012) for log(t yr-1) = 8.1, 8.2, and 8.3 and Z = 0.006 are also superimposed. The schematic diagram centred on the cluster is shown in the bottom right-hand panel. The black circle represents the adopted cluster radius. Symbols are as in the bottom left-hand panel, with sizes proportional to the stellar brightnesses. North is up; east is to the left. The actual images are shown in Fig. A.1. |
| In the text | |
|
Fig. 4 Cleaned CMDs for OGLE-CL LMC 451 (left) and OGLE-CL LMC 469 (right) in the Washington CT1 (top) and YKs (bottom) filters. |
| In the text | |
|
Fig. 5 CF of the surveyed region in the LMC bar (filled circles). The grey areas highlight the periods of star cluster formation activity, while the solid line represents the CF recovered from the corresponding SFR obtained by Smecker-Hane et al. (2002). |
| In the text | |
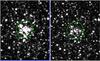 |
Fig. A.1 C (left) and R (right) images centred on OGLE-CL LMC 377. The circles are as in Fig. 3. |
| In the text | |
|
Fig. B.1 3×3 arcmin2 DSS Red (left) and R (right) images centred on objects catalogued by B08 (see text for details). North is up and East to the left. The green circle illustrates the angular dimension given in B08. |
| In the text | |
|
Fig. B.1 continued. |
| In the text | |
|
Fig. B.1 continued. |
| In the text | |
|
Fig. B.1 continued. |
| In the text | |
|
Fig. B.1 continued. |
| In the text | |
Current usage metrics show cumulative count of Article Views (full-text article views including HTML views, PDF and ePub downloads, according to the available data) and Abstracts Views on Vision4Press platform.
Data correspond to usage on the plateform after 2015. The current usage metrics is available 48-96 hours after online publication and is updated daily on week days.
Initial download of the metrics may take a while.