Fig. 5
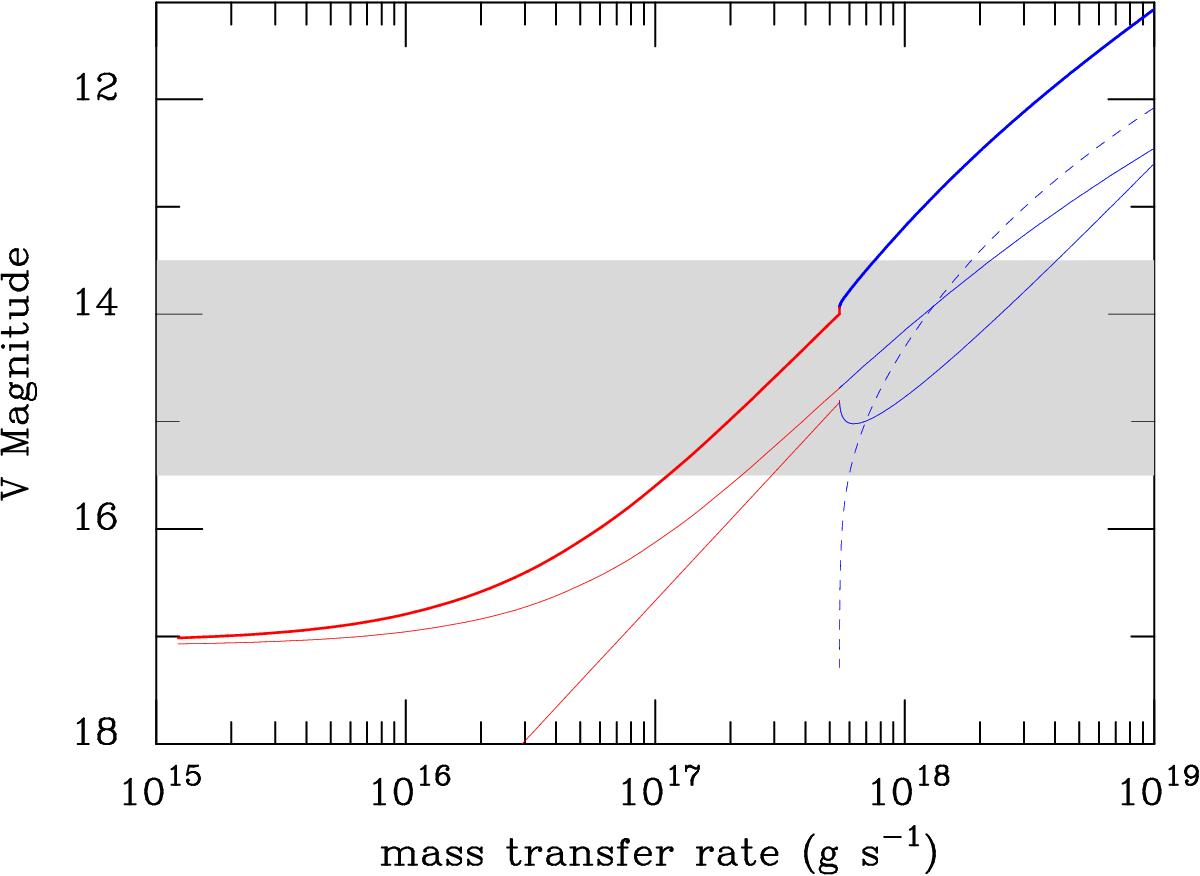
Optical magnitude for a system with the parameters of FO Aqr (see text) and μ = 1.5 × 1033 G cm3, as a function of the mass-transfer rate. The thick solid line is the total optical luminosity; the thin dashed curve represents the disc contribution and the upper and lower thin solid curves represent the secondary and hot spot contributions, respectively. The red portion of the curve corresponds to discless accretion. The grey area corresponds to the optical luminosity variations between the normal- and low states.
Current usage metrics show cumulative count of Article Views (full-text article views including HTML views, PDF and ePub downloads, according to the available data) and Abstracts Views on Vision4Press platform.
Data correspond to usage on the plateform after 2015. The current usage metrics is available 48-96 hours after online publication and is updated daily on week days.
Initial download of the metrics may take a while.