Free Access
Fig. 4
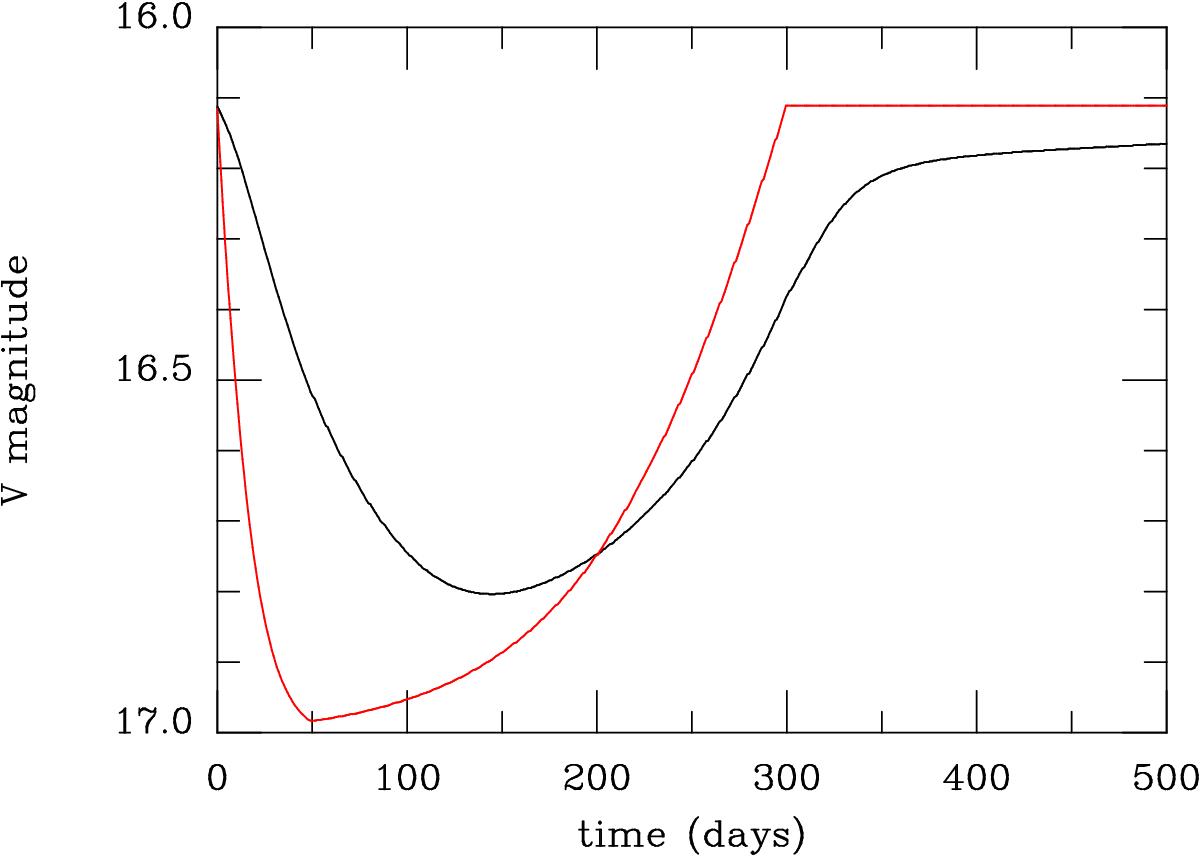
Light curve of a system remaining on the cold branch, in which the mass-transfer rate decreases exponentially by a factor 10 during the first 50 days, then recovers on a time scale of 250 days. The black curve is the actual V magnitude, while the red one corresponds to a steady state system.
Current usage metrics show cumulative count of Article Views (full-text article views including HTML views, PDF and ePub downloads, according to the available data) and Abstracts Views on Vision4Press platform.
Data correspond to usage on the plateform after 2015. The current usage metrics is available 48-96 hours after online publication and is updated daily on week days.
Initial download of the metrics may take a while.