Free Access
Fig. 2
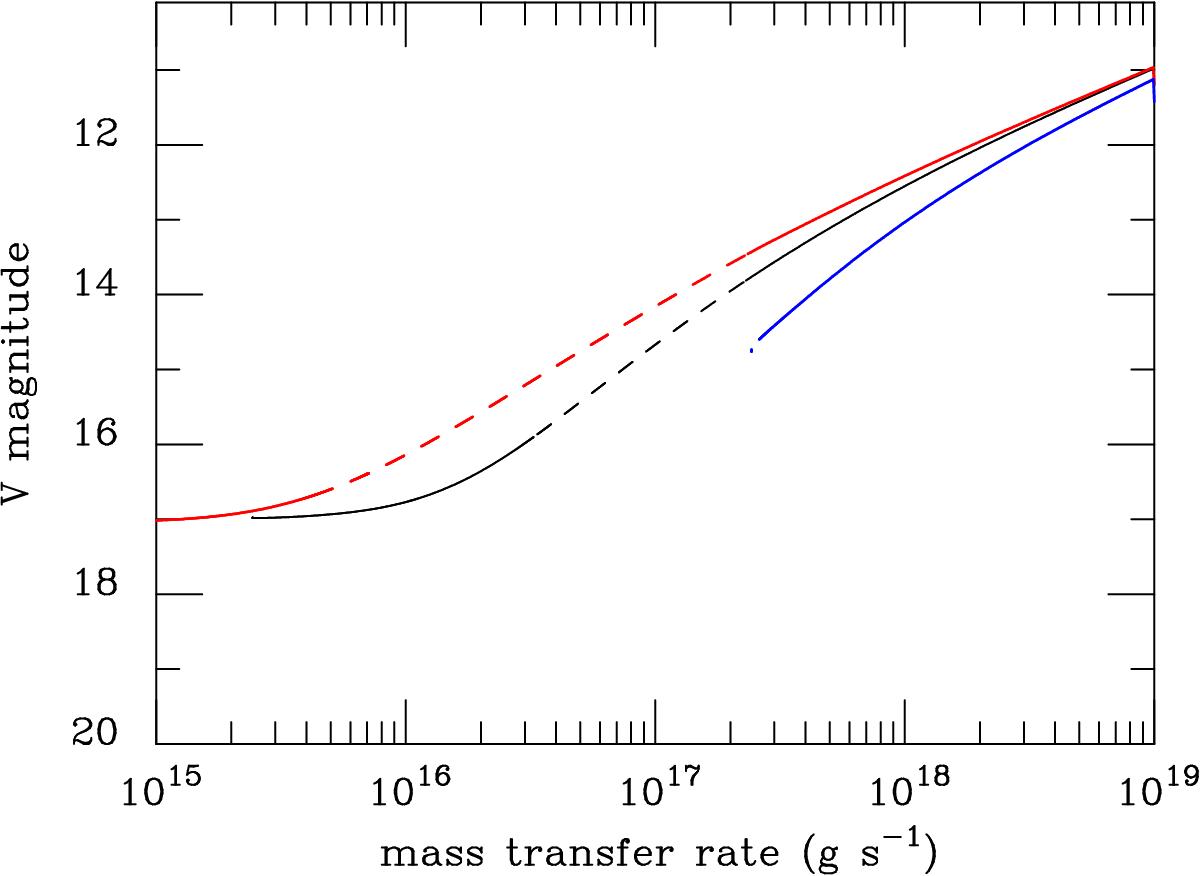
Visual magnitude for a system with the parameters of FO Aqr (see text), as a function of the mass-transfer rate from the secondary, for μ30 = 10 (red curve), 100 (black curve), and 1000 (blue curve). The dashed portion of these curves corresponds to unstable cases.
Current usage metrics show cumulative count of Article Views (full-text article views including HTML views, PDF and ePub downloads, according to the available data) and Abstracts Views on Vision4Press platform.
Data correspond to usage on the plateform after 2015. The current usage metrics is available 48-96 hours after online publication and is updated daily on week days.
Initial download of the metrics may take a while.