Fig. 8
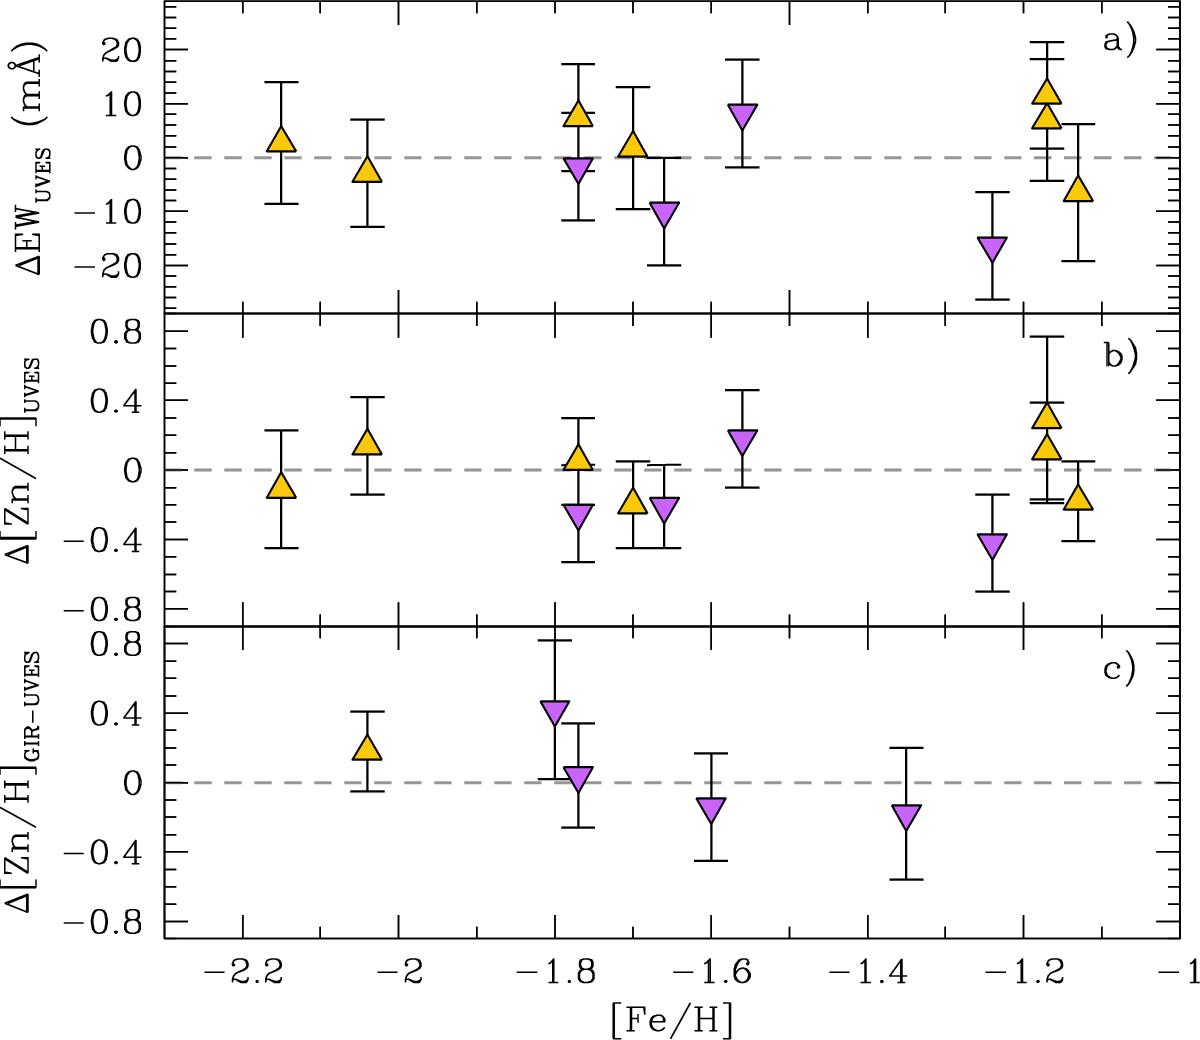
Comparison of our Zn measurements with those from the literature. Errorbars show the combined uncertainties of both measurements. Downward pointing violet triangles are stars from Shetrone et al. (2003) and orange triangles are stars from Hill et al. (in prep.). The panels show differences of: a) the measured EW of the Zn line at 4810.5 Å, between the literature and this work, in all cases using the same UVES spectra; b) the [Zn/Fe] measurements, between the literature and this work, in all cases using the same UVES spectra; c) the [Zn/Fe] measurements from the GIRAFFE HR7A and UVES spectra, as measured by this work.
Current usage metrics show cumulative count of Article Views (full-text article views including HTML views, PDF and ePub downloads, according to the available data) and Abstracts Views on Vision4Press platform.
Data correspond to usage on the plateform after 2015. The current usage metrics is available 48-96 hours after online publication and is updated daily on week days.
Initial download of the metrics may take a while.