Fig. 6
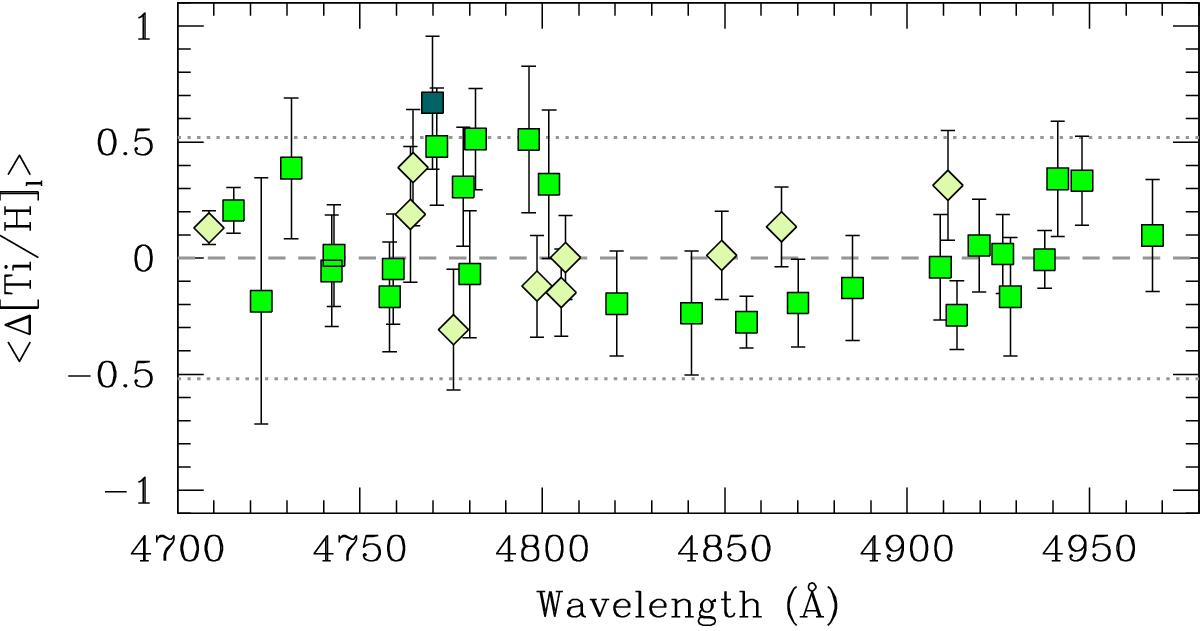
Average deviation of the measured Ti lines from the mean, as a function of wavelength, equivalent to Fig. 4. Green squares are Ti I lines, pale green diamonds are Ti II lines and the dark green square is a Ti I line falling out of the criteria. The bluest part of the spectrum (<4740 Å) is only usable for the brightest stars, so these points and their standard deviations are determined from measurements in ≤6 stars.
Current usage metrics show cumulative count of Article Views (full-text article views including HTML views, PDF and ePub downloads, according to the available data) and Abstracts Views on Vision4Press platform.
Data correspond to usage on the plateform after 2015. The current usage metrics is available 48-96 hours after online publication and is updated daily on week days.
Initial download of the metrics may take a while.