Fig. 7
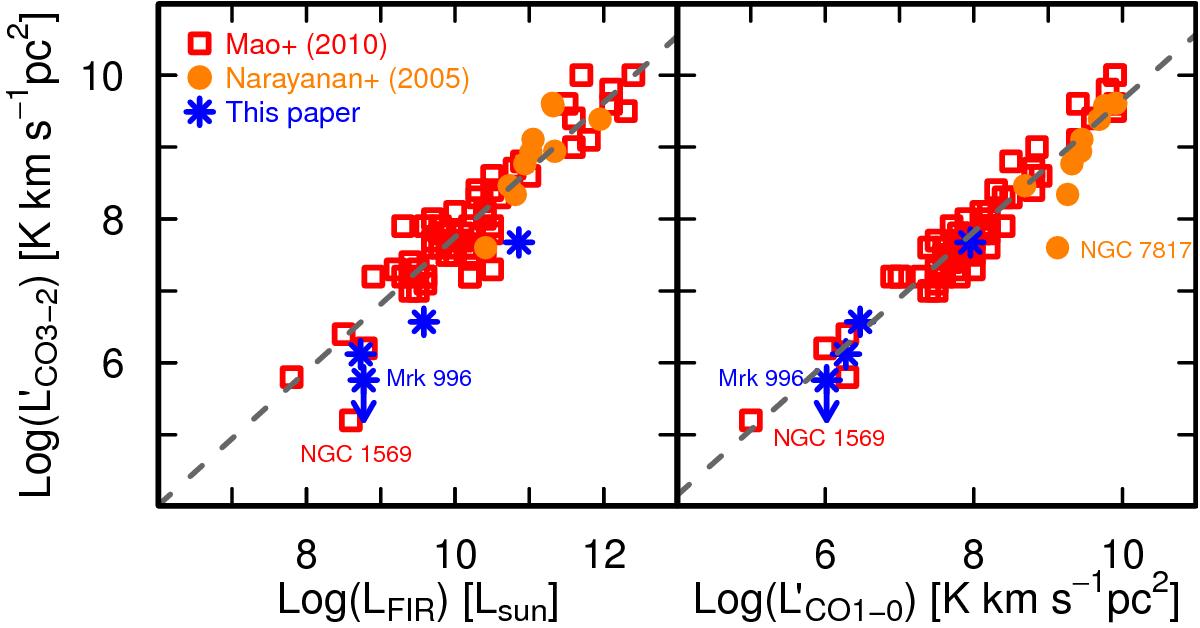
CO(3-2) luminosity, ![]() , plotted against FIR luminosity, LFIR (left panel) and CO(1–0) luminosity,
, plotted against FIR luminosity, LFIR (left panel) and CO(1–0) luminosity, ![]() (right) for our targets. Also shown are values taken from Mao et al. (2010) and Narayanan et al. (2005), see text for more discussion. The dashed lines show a robust unweighted regression for
(right) for our targets. Also shown are values taken from Mao et al. (2010) and Narayanan et al. (2005), see text for more discussion. The dashed lines show a robust unweighted regression for ![]() against the two variables plotted along the x-axis, not including our data. Some galaxies with extreme values are labeled. The left panel suggests that CO emission traced by the 12CO(3–2) transition is deficient relative to LFIR (like 12CO(1–0), see Hunt et al. 2015), but that 12CO(3–2) relative to 12CO(1–0) is roughly consistent, implying that the excitation conditions in these metal-poor galaxies are similar to those in the metal-rich galaxy samples taken from the literature.
against the two variables plotted along the x-axis, not including our data. Some galaxies with extreme values are labeled. The left panel suggests that CO emission traced by the 12CO(3–2) transition is deficient relative to LFIR (like 12CO(1–0), see Hunt et al. 2015), but that 12CO(3–2) relative to 12CO(1–0) is roughly consistent, implying that the excitation conditions in these metal-poor galaxies are similar to those in the metal-rich galaxy samples taken from the literature.
Current usage metrics show cumulative count of Article Views (full-text article views including HTML views, PDF and ePub downloads, according to the available data) and Abstracts Views on Vision4Press platform.
Data correspond to usage on the plateform after 2015. The current usage metrics is available 48-96 hours after online publication and is updated daily on week days.
Initial download of the metrics may take a while.