Fig. 2
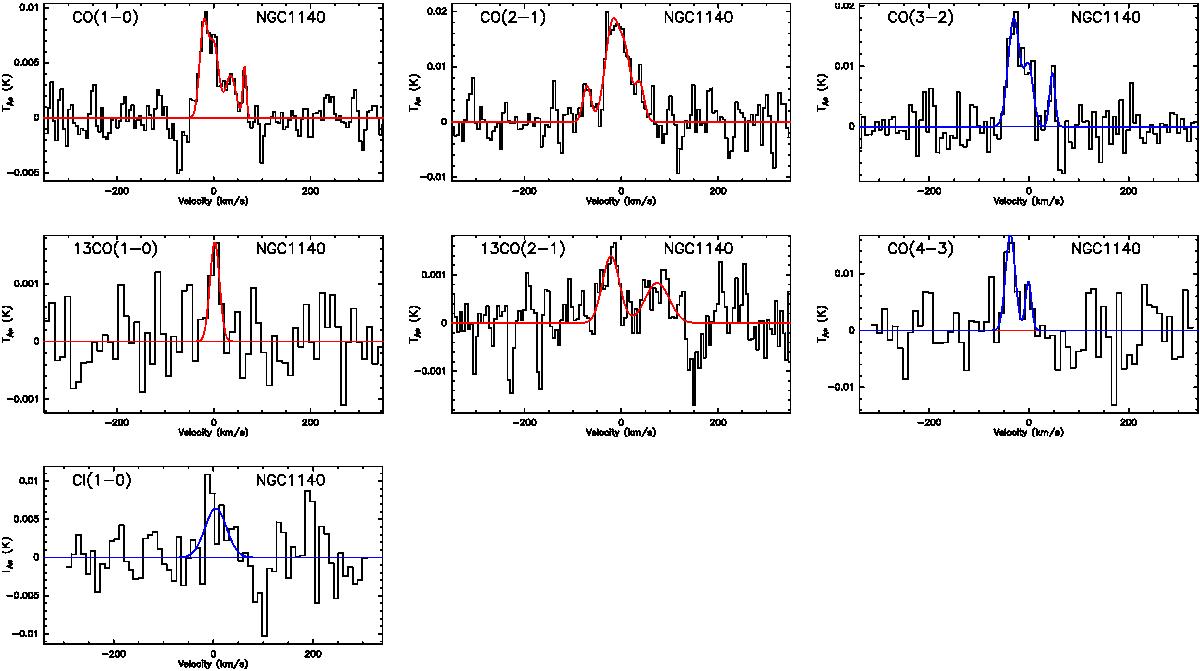
12CO, 13CO, and [Ci](1–0) transitions for NGC 1140. Top row: 12CO(1–0), 12CO(2–1) (IRAM), and 12CO(3–2) (APEX); second row: 13CO(1–0), 13CO(2–1) (IRAM), and 12CO(4–3) (APEX); third row: [Ci](1–0) (APEX). As in Fig. 1, the baselines are shown as a horizontal solid line, together with the multiple-component Gaussian fits as described in Sect. 3.3. The vertical axes are in ![]() units, while in Table 4 the units are Tmb, converted from
units, while in Table 4 the units are Tmb, converted from ![]() as described in Sect. 3.3. Velocity channels are as reported in Table 2. The red curves and lines refer to 30-m spectra, while the blue ones to APEX.
as described in Sect. 3.3. Velocity channels are as reported in Table 2. The red curves and lines refer to 30-m spectra, while the blue ones to APEX.
Current usage metrics show cumulative count of Article Views (full-text article views including HTML views, PDF and ePub downloads, according to the available data) and Abstracts Views on Vision4Press platform.
Data correspond to usage on the plateform after 2015. The current usage metrics is available 48-96 hours after online publication and is updated daily on week days.
Initial download of the metrics may take a while.