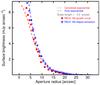
Fig. A.3
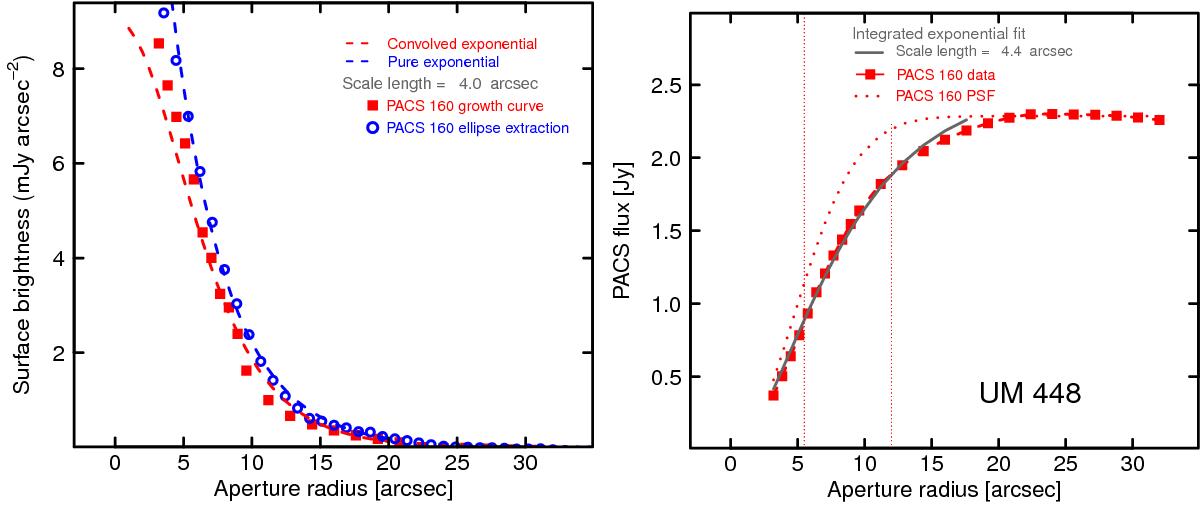
Left panel: PACS 160 μm radial surface brightness profile of UM 448; open (blue) circles give the profile obtained from averaging the image over fixed-position-angle ellipses, and filled (red) squares the analogous profile obtained from the first derivative of the photometric growth curve. As in Fig. A.1, the dashed curves show the exponential convolved with the PACS 160 μm beam (lower), and the upper the exponential without convolution; the best-fit scale length is 4.̋0. Right panel: PACS 160 μm growth curve centered on the brightness peak. The left-most dotted vertical line gives the PACS beam radius (~5.̋5) and the right-most one the optical radius of UM 448 taken from NED (12′′). The solid grey curve corresponds to the best-fit exponential integral as described in the text; like NGC 3353, the growth-curve best fit scalelength for UM 448 is slightly different from the radial profile one and we have adopted the growth-curve value for beam corrections.
Current usage metrics show cumulative count of Article Views (full-text article views including HTML views, PDF and ePub downloads, according to the available data) and Abstracts Views on Vision4Press platform.
Data correspond to usage on the plateform after 2015. The current usage metrics is available 48-96 hours after online publication and is updated daily on week days.
Initial download of the metrics may take a while.