Fig. 16
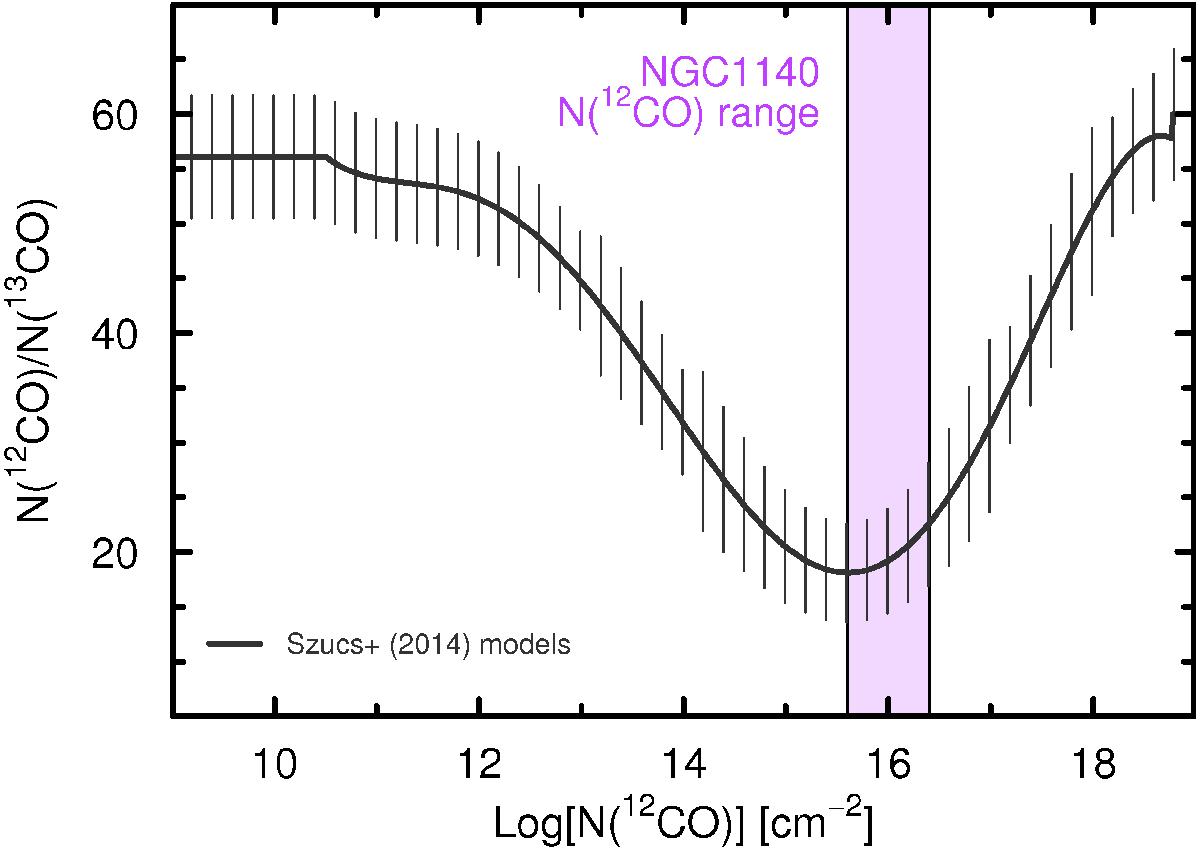
12CO/13CO abundance ratio plotted against N(12CO). The shaded rectangle shows the ranges of values from RADEX fits (ΔV = 20 km s-1) of NGC 1140. The solid line corresponds to the models of the 12CO/13CO abundance ratio vs. the 12CO column density by Szűcs et al. (2014). The error bars for these models (vertical black lines) are (very roughly) estimated from their Fig. 8.
Current usage metrics show cumulative count of Article Views (full-text article views including HTML views, PDF and ePub downloads, according to the available data) and Abstracts Views on Vision4Press platform.
Data correspond to usage on the plateform after 2015. The current usage metrics is available 48-96 hours after online publication and is updated daily on week days.
Initial download of the metrics may take a while.