Fig. 13
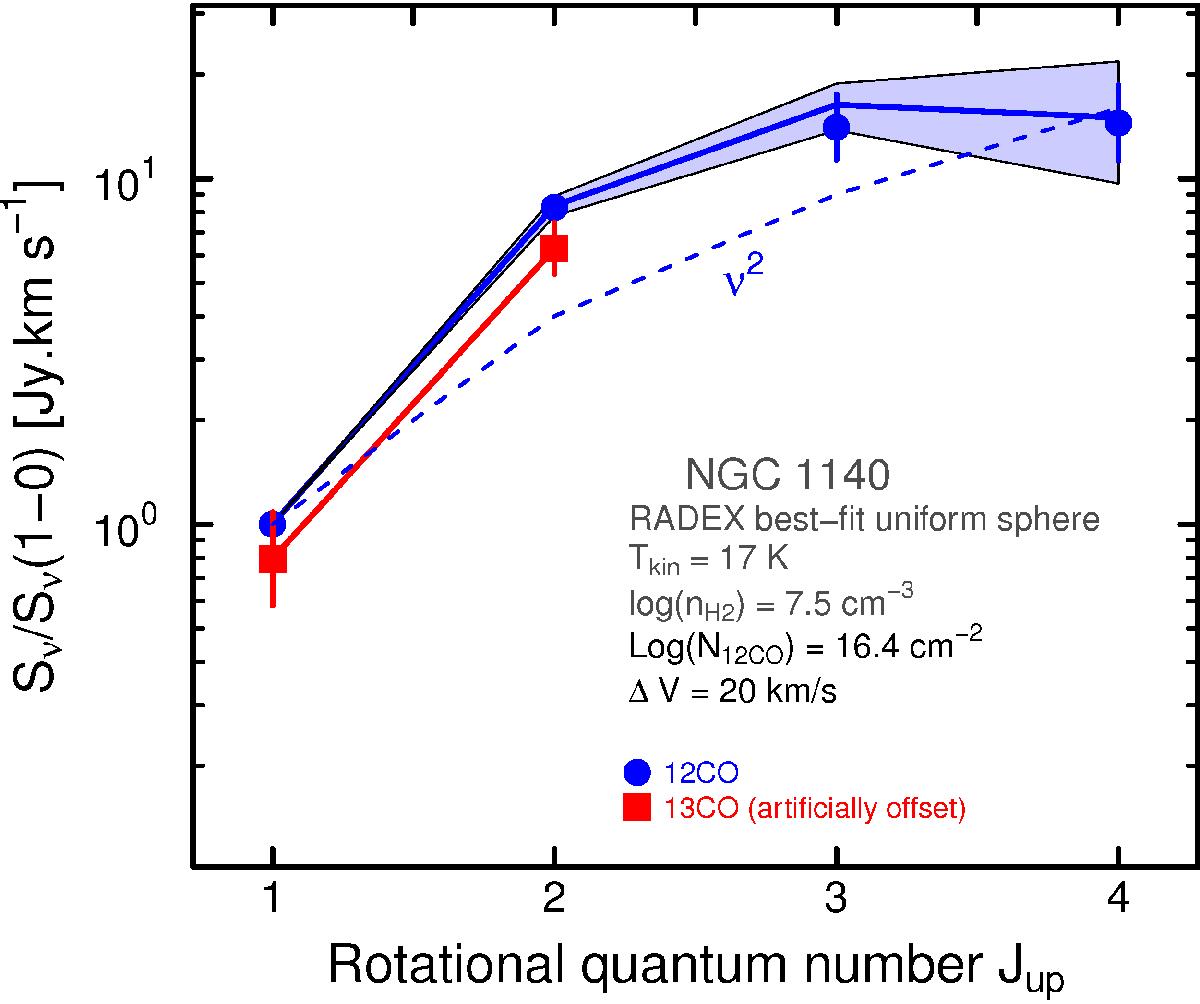
RADEX best-fit model compared to observations for the CO excitation ladder of NGC 1140; the observations have been corrected for beam size as described in Sect. 4, and normalized to the CO(1–0) flux. The observations are shown as filled blue circles (12CO) and red squares (13CO), and the range of the allowed RADEX models by the light-blue region (for 12CO); 13CO points have arbitrarily offset relative to 12CO for clarity. The dashed curve shows the ν2 behavior (here normalized to J = 1) expected for optically-thick emission.
Current usage metrics show cumulative count of Article Views (full-text article views including HTML views, PDF and ePub downloads, according to the available data) and Abstracts Views on Vision4Press platform.
Data correspond to usage on the plateform after 2015. The current usage metrics is available 48-96 hours after online publication and is updated daily on week days.
Initial download of the metrics may take a while.