Fig. 8
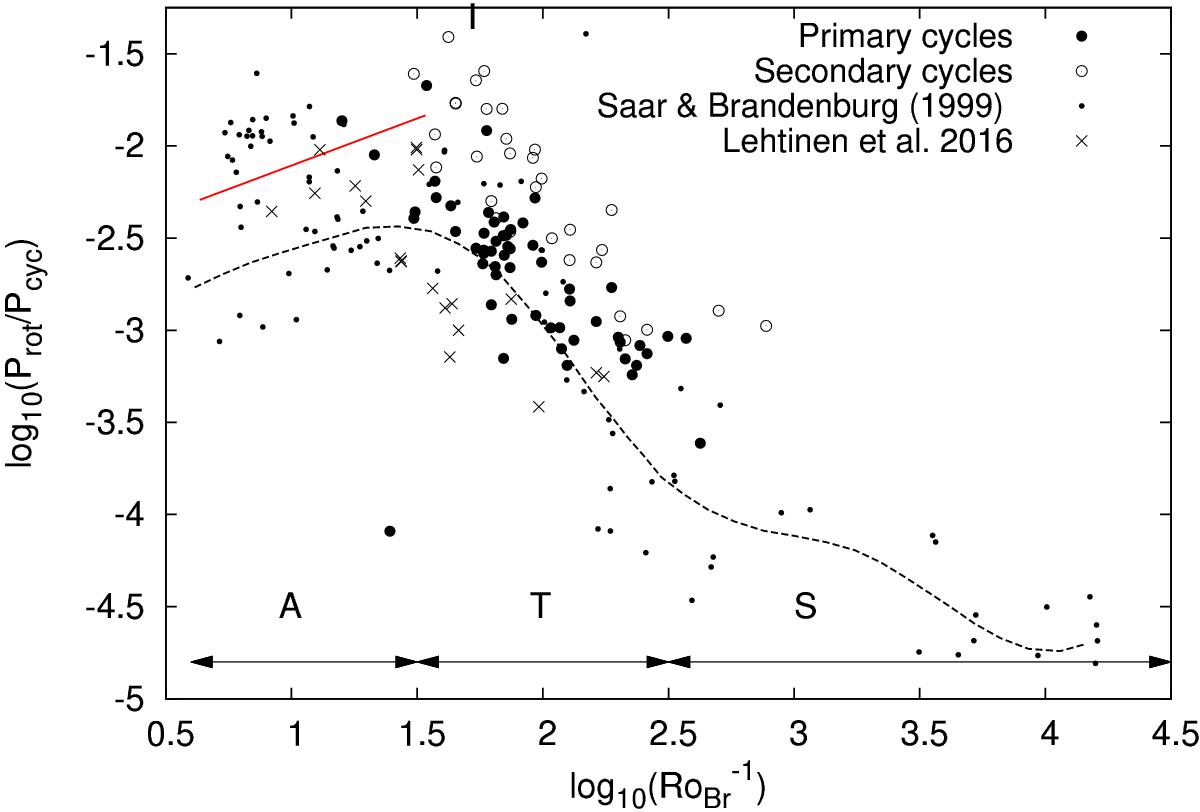
Ratio of ![]() ratio versus RoBr number. The filled bullets indicate the primary cycles and the empty bullets indicate the secondary cycles. The black points and the black crosses indicate the results by Saar & Brandenburg (1999) and Lehtinen et al. (2016), respectively. The red continuous line depicts the inactive sequence. The black dotted line depicts the curve inferred by Lehtinen et al. (2016) and connects the active, the transitional and the super active sequence. The RoBr ranges corresponding to the three sequences are indicated with the black arrows and labelled A, T, and S, respectively.
ratio versus RoBr number. The filled bullets indicate the primary cycles and the empty bullets indicate the secondary cycles. The black points and the black crosses indicate the results by Saar & Brandenburg (1999) and Lehtinen et al. (2016), respectively. The red continuous line depicts the inactive sequence. The black dotted line depicts the curve inferred by Lehtinen et al. (2016) and connects the active, the transitional and the super active sequence. The RoBr ranges corresponding to the three sequences are indicated with the black arrows and labelled A, T, and S, respectively.
Current usage metrics show cumulative count of Article Views (full-text article views including HTML views, PDF and ePub downloads, according to the available data) and Abstracts Views on Vision4Press platform.
Data correspond to usage on the plateform after 2015. The current usage metrics is available 48-96 hours after online publication and is updated daily on week days.
Initial download of the metrics may take a while.