Fig. 6
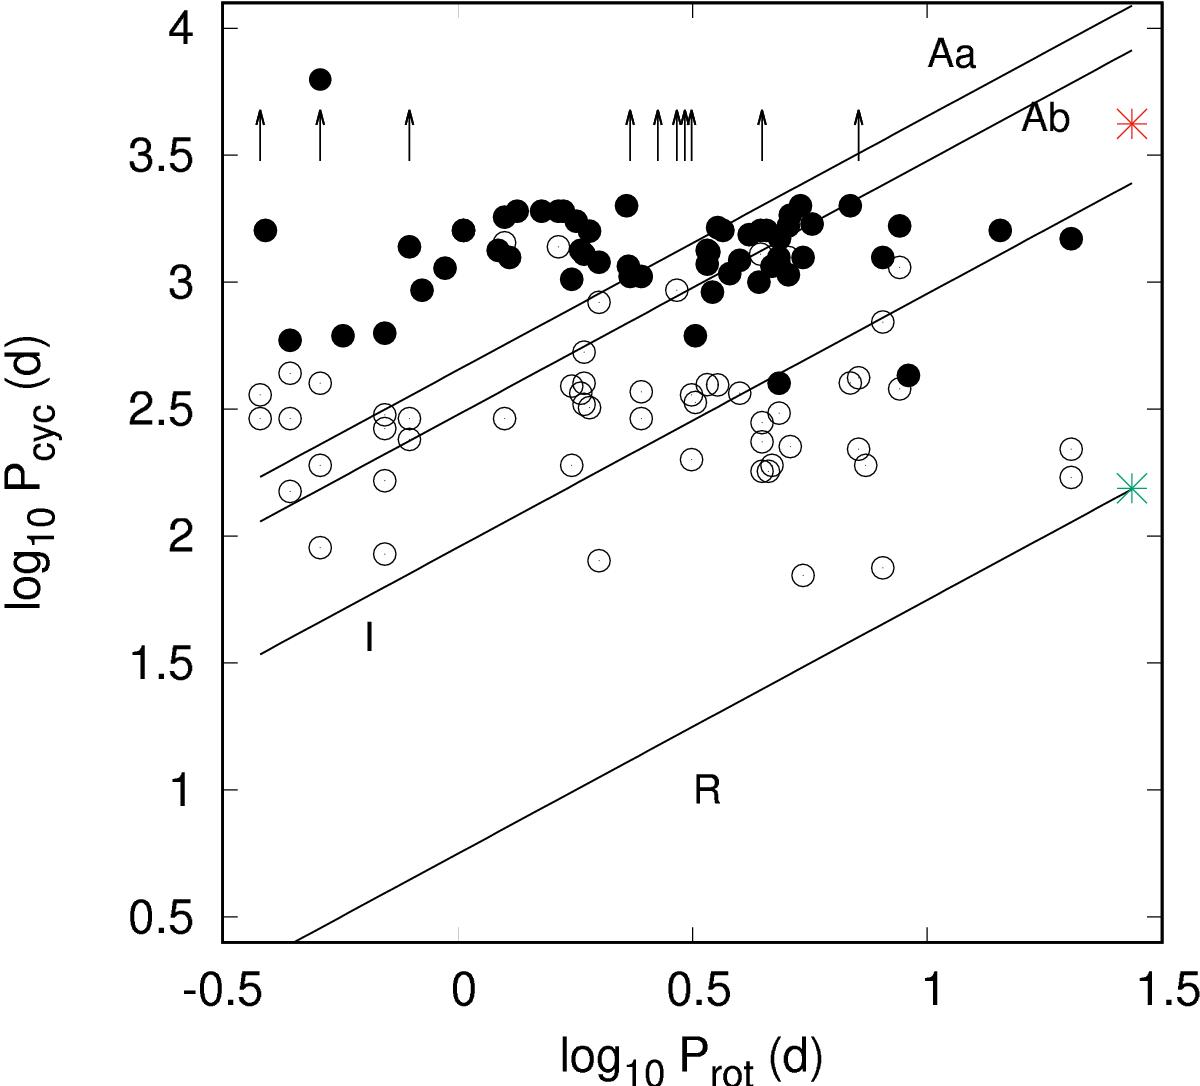
Pcyc length versus stellar rotation period Prot. The filled circles indicate the primary cycles and the empty circles the secondary cycles. The arrows indicate the stars for which the visual inspection of time series revealed Pcyc ≥ 3000 d. The continuous line, dashed line, and dotted line represent the Aa, Ab, and I sequences identified by Böhm-Vitense (2007), respectively. The dash-dotted line represents the locus where the ![]() ratio is equal to the ratio between the typical length of the Rieger cycle and the solar rotation period. The red asterisk indicates the solar Schwabe cycle; the green asterisk indicates the solar Rieger cycle.
ratio is equal to the ratio between the typical length of the Rieger cycle and the solar rotation period. The red asterisk indicates the solar Schwabe cycle; the green asterisk indicates the solar Rieger cycle.
Current usage metrics show cumulative count of Article Views (full-text article views including HTML views, PDF and ePub downloads, according to the available data) and Abstracts Views on Vision4Press platform.
Data correspond to usage on the plateform after 2015. The current usage metrics is available 48-96 hours after online publication and is updated daily on week days.
Initial download of the metrics may take a while.