Fig. 12
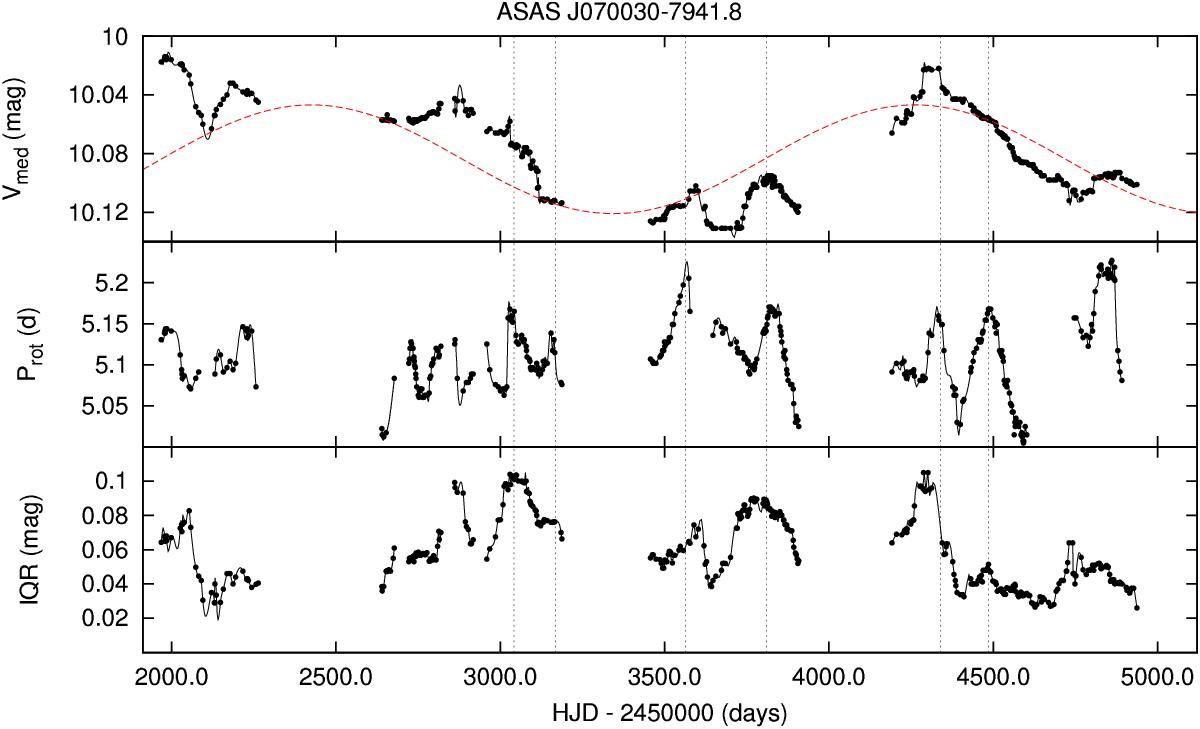
Time series for star ASAS J070030-7941.8. Top panel: Vmed time series for the star ASAS J070030-7941.8 is shown. Middle panel: Prot time series is shown. Bottom panel: IQR time series is shown. A primary cycle with length Pcyc = 1834 d was detected in the Vmed time series and the sinusoid best fitting the data was overplotted on it (red dashed line). The Prot and the IQR time series exhibit cycles (dark continuous lines) shorter than the primary cycle. The black dotted lines indicate the times at which maxima occur in the Prot time series.
Current usage metrics show cumulative count of Article Views (full-text article views including HTML views, PDF and ePub downloads, according to the available data) and Abstracts Views on Vision4Press platform.
Data correspond to usage on the plateform after 2015. The current usage metrics is available 48-96 hours after online publication and is updated daily on week days.
Initial download of the metrics may take a while.