Fig. 2
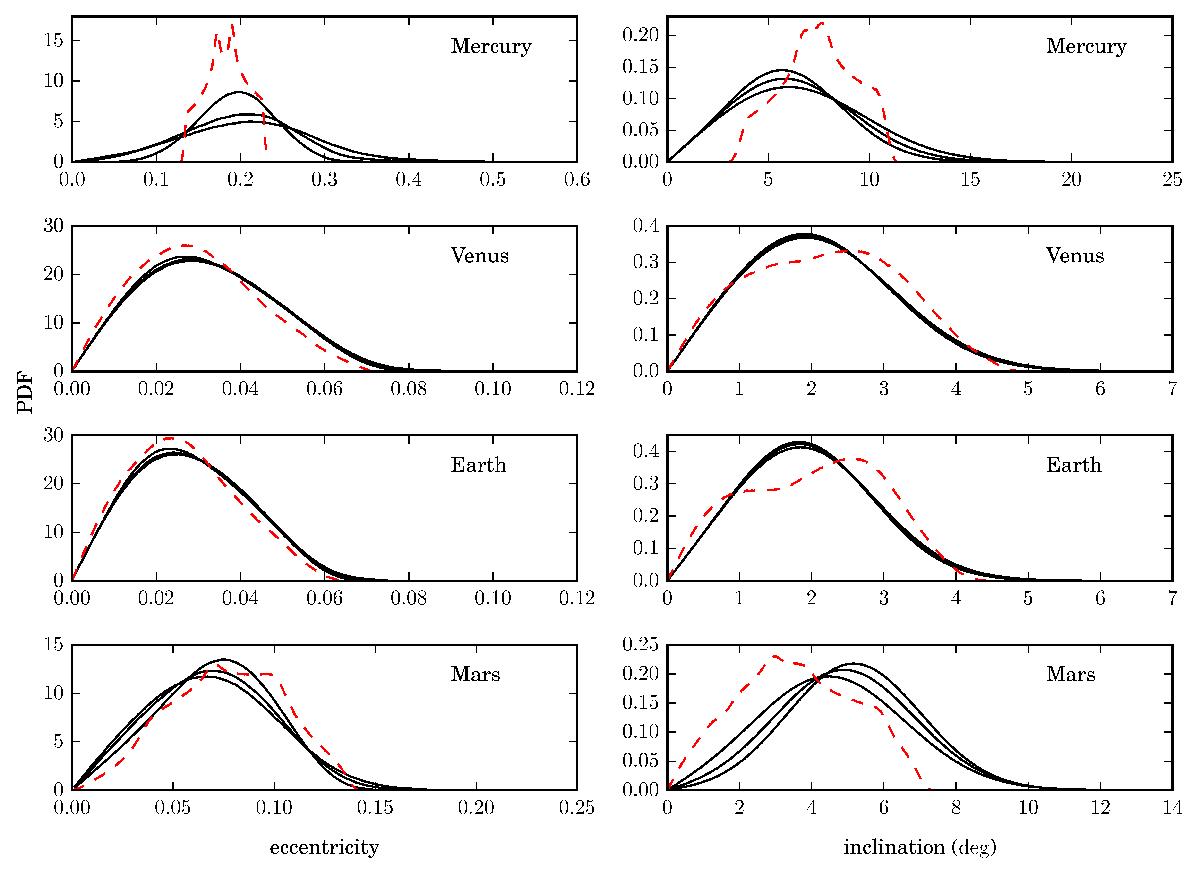
Eccentricity and inclination PDFs of the solar system inner planets. The PDFs of L08 are plotted in solid lines at three different times, t = 500 Myr, 2.5 Gyr, and 5 Gyr, to illustrate chaotic diffusion (the PDF broadens and its peak decreases as time increases; the inclination PDFs are not the original PDFs, but the Rice distributions fitted by Laskar, see Sect. 3 for explanations). The PDFs predicted by the microcanonical ensemble of the Laplace-Lagrange theory, Eq. (16), are shown in dashed line. The inclinations are computed with respect to the J2000 ecliptic.
Current usage metrics show cumulative count of Article Views (full-text article views including HTML views, PDF and ePub downloads, according to the available data) and Abstracts Views on Vision4Press platform.
Data correspond to usage on the plateform after 2015. The current usage metrics is available 48-96 hours after online publication and is updated daily on week days.
Initial download of the metrics may take a while.