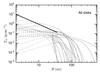
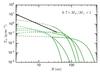
Fig. 13

Left: dust surface density profiles inferred for all the disks in our Lupus sample (gray curves) compared to the Hayashi (1981) dust surface density model for the solar system (black thick line). The inferred surface density profiles are dashed where they are not spatially resolved, that is for R< 25 au. Right: dust surface density profiles for the sources in the 0.7–1M⊙ stellar mass bin.
Current usage metrics show cumulative count of Article Views (full-text article views including HTML views, PDF and ePub downloads, according to the available data) and Abstracts Views on Vision4Press platform.
Data correspond to usage on the plateform after 2015. The current usage metrics is available 48-96 hours after online publication and is updated daily on week days.
Initial download of the metrics may take a while.