Fig. 9
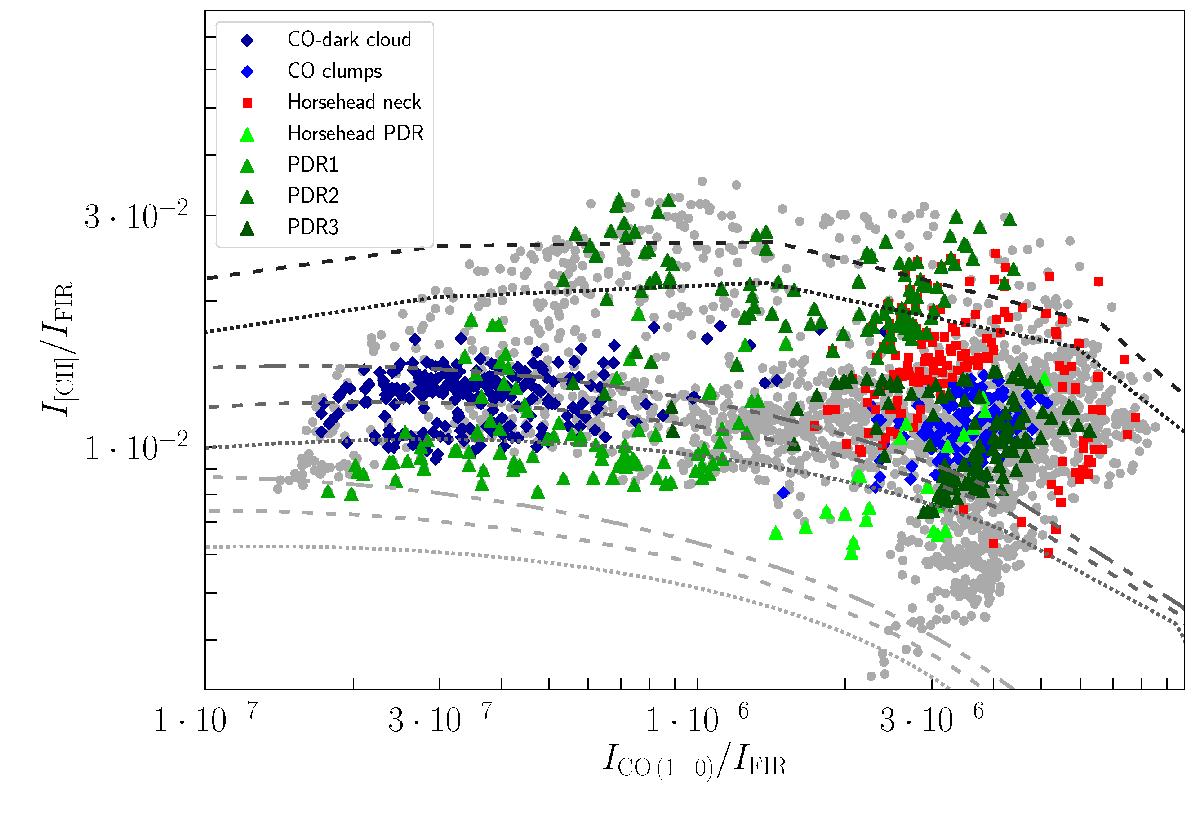
Correlation plot of I[ C ii ]/IFIR versus ICO (1 − 0)/IFIR. Edge-on model predictions for selected gas densities are plotted as lines. Dashed lines are for AV,los = 2.5, with dark gray corresponding to a gas density of nH = 3.0 × 103 cm-3, medium gray to nH = 1.6 × 104 cm-3, and light gray to nH = 4.0 × 104 cm-3; dotted lines are the same but for AV,los = 5.0; the medium and light gray dash-dotted lines are for AV,los = 0.5, with nH = 1.6 × 104 cm-3 and nH = 4.0 × 104 cm-3, respectively.
Current usage metrics show cumulative count of Article Views (full-text article views including HTML views, PDF and ePub downloads, according to the available data) and Abstracts Views on Vision4Press platform.
Data correspond to usage on the plateform after 2015. The current usage metrics is available 48-96 hours after online publication and is updated daily on week days.
Initial download of the metrics may take a while.