Fig. 7
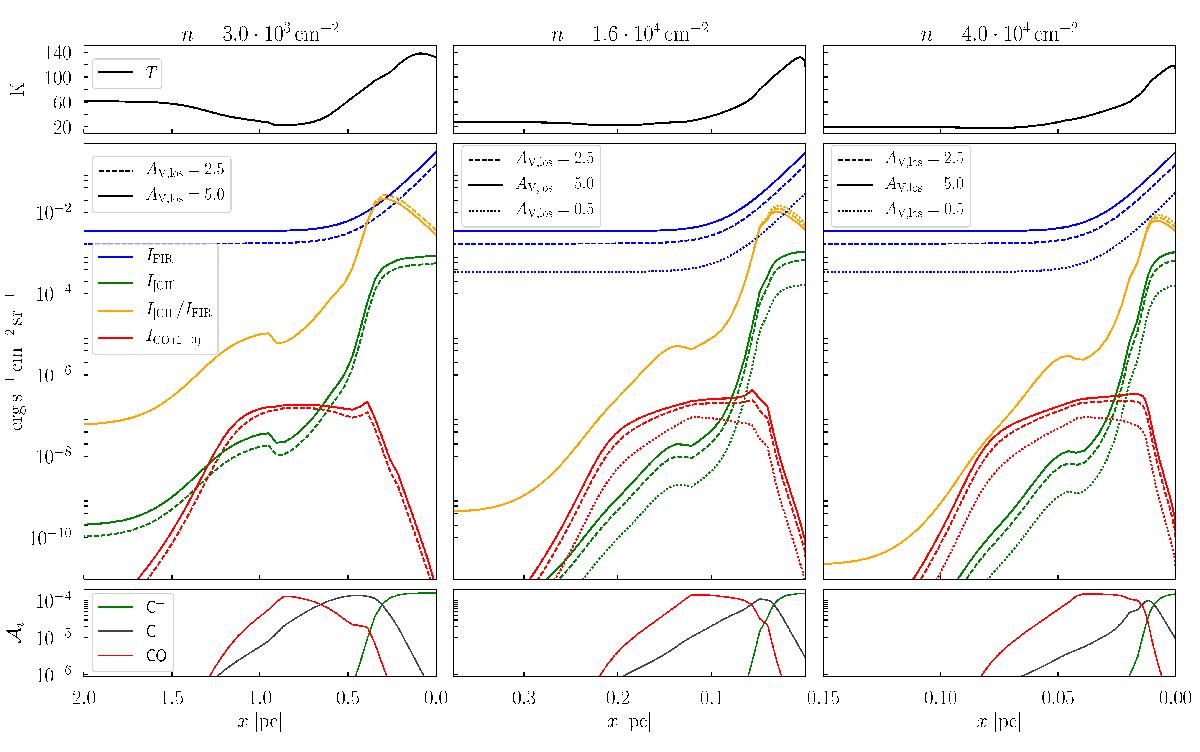
Results of our edge-on models described in Sect. 3.4. The panels show the gas temperature T (upper panels), IFIR, I[ C ii ], I[ C ii ]/IFIR, and ICO (1 − 0) (middle panels) and C+, C, and CO fractional abundances (lower panels) versus physical scale, for the gas densities nH = 3.0 × 103 cm-3,1.6 × 104 cm-3,4.0 × 104 cm-3 (left to right panels), and AV,los = 0.5, 2.5, and5.0. We note that the gas temperature does not vary with AV,los.
Current usage metrics show cumulative count of Article Views (full-text article views including HTML views, PDF and ePub downloads, according to the available data) and Abstracts Views on Vision4Press platform.
Data correspond to usage on the plateform after 2015. The current usage metrics is available 48-96 hours after online publication and is updated daily on week days.
Initial download of the metrics may take a while.