Fig. 5
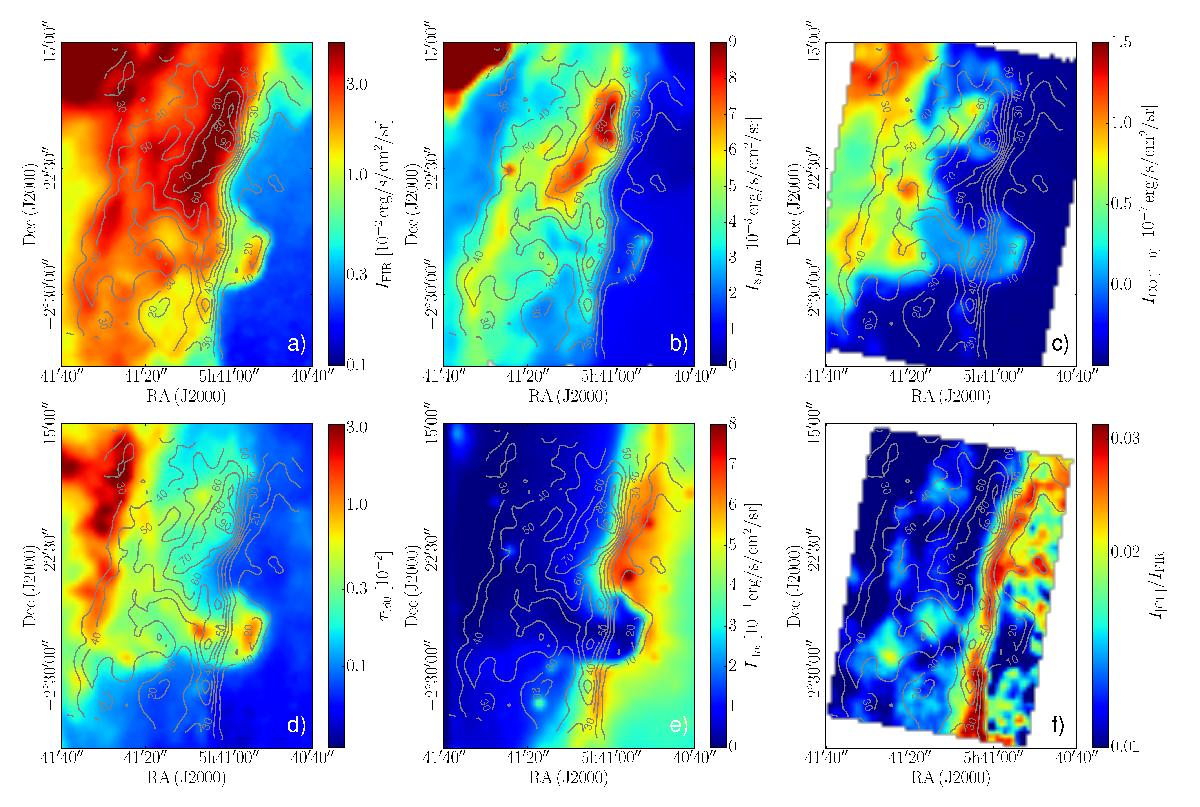
Different quantities with [C ii] emission in units of K km s-1 in contours: IFIR tracing the UV radiation field re-radiated in the FIR by dust particles, I8 μm tracing the UV radiation field by fluorescence of PAHs, ICO (1 − 0) tracing the molecular gas, τ160 tracing the dust column, IHα emitted by ionized gas, and, finally, the ratio I[ C ii ]/IFIR. All maps are convolved to 36″ spatial resolution and re-gridded to a pixel size of 14″, that of the SPIRE 500 μm map.
Current usage metrics show cumulative count of Article Views (full-text article views including HTML views, PDF and ePub downloads, according to the available data) and Abstracts Views on Vision4Press platform.
Data correspond to usage on the plateform after 2015. The current usage metrics is available 48-96 hours after online publication and is updated daily on week days.
Initial download of the metrics may take a while.