Free Access
Fig. 4
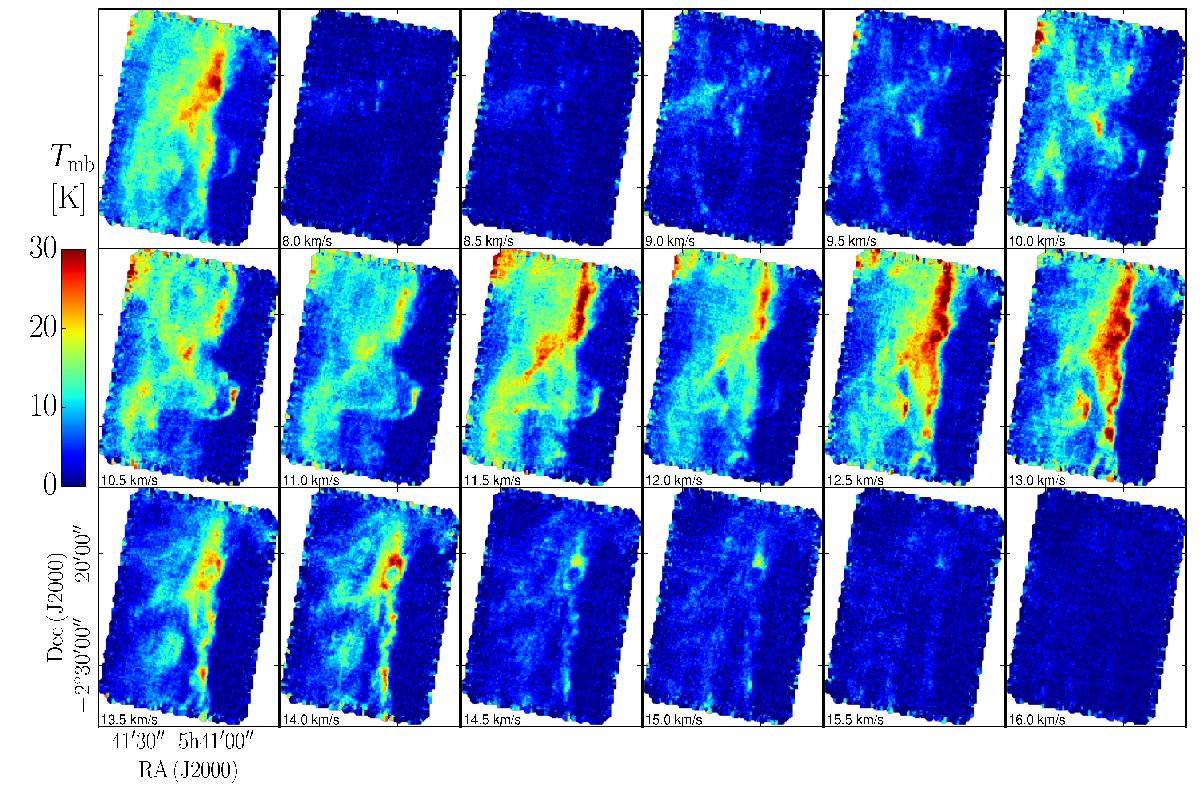
[C ii] channel maps from 8.0 km s-1 to 16.0 km s-1 in steps of dv = 0.5 km s-1 at 15.9″ resolution. The main-beam temperature Tmb is averaged over the step size dv. The first panel shows the line-integrated intensity.
Current usage metrics show cumulative count of Article Views (full-text article views including HTML views, PDF and ePub downloads, according to the available data) and Abstracts Views on Vision4Press platform.
Data correspond to usage on the plateform after 2015. The current usage metrics is available 48-96 hours after online publication and is updated daily on week days.
Initial download of the metrics may take a while.