Free Access
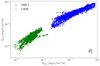
Fig. 19
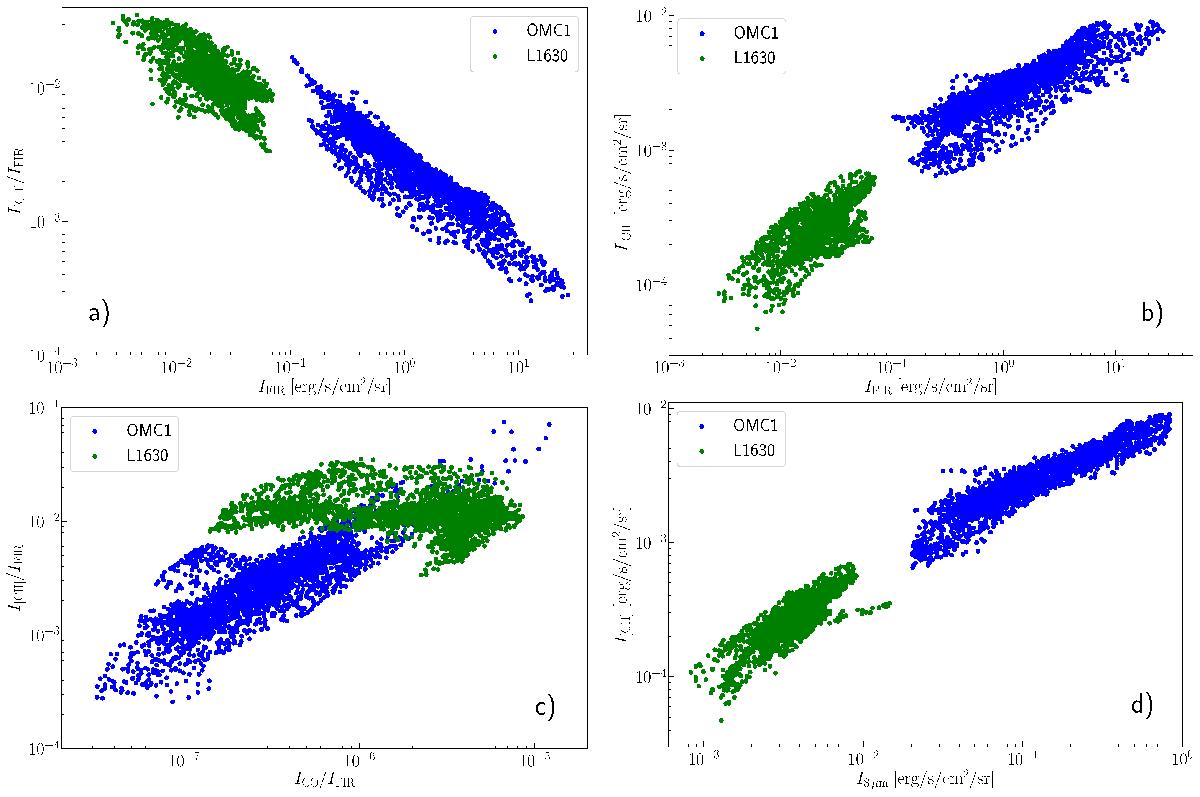
Correlation plots for L1630 (Orion B) and OMC1 (Orion A); the OMC1 data are convolved to 25″ resolution, L1630 data to 36″ resolution. CO data are for the CO (1 − 0) line in L1630 and for the CO (2 − 1) line, divided by 8 (see Sect. 4.10), in OMC1.
This figure is made of several images, please see below:
Current usage metrics show cumulative count of Article Views (full-text article views including HTML views, PDF and ePub downloads, according to the available data) and Abstracts Views on Vision4Press platform.
Data correspond to usage on the plateform after 2015. The current usage metrics is available 48-96 hours after online publication and is updated daily on week days.
Initial download of the metrics may take a while.