Free Access
Fig. 13
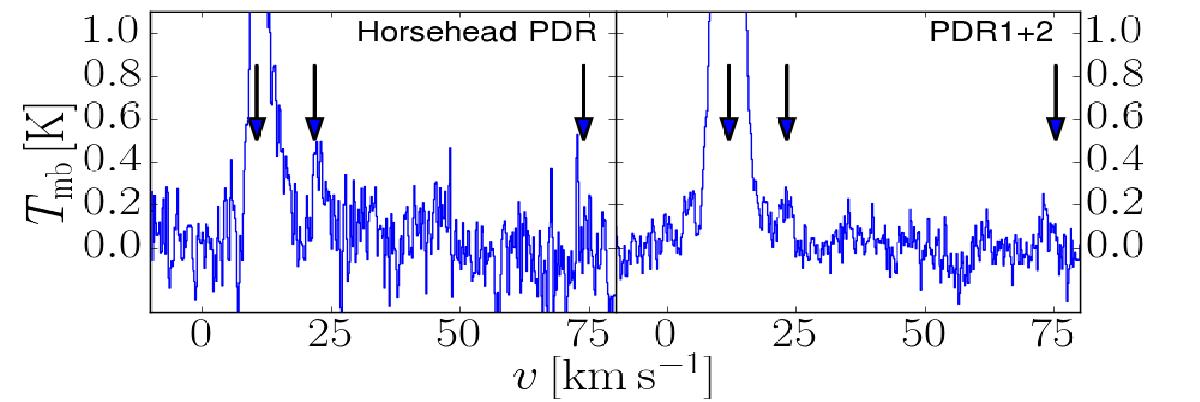
[C ii] spectra towards the Horsehead PDR and PDR1+2, averaged over 180 (left) and 3140 (right) pixels. Arrows indicate the positions of the [12C ii] line and the [13C ii] F = 2 − 1 and F = 1 − 1 lines (from left to right); the [13C ii] F = 1 − 0 line falls outside the spectral range of our map.
Current usage metrics show cumulative count of Article Views (full-text article views including HTML views, PDF and ePub downloads, according to the available data) and Abstracts Views on Vision4Press platform.
Data correspond to usage on the plateform after 2015. The current usage metrics is available 48-96 hours after online publication and is updated daily on week days.
Initial download of the metrics may take a while.