Fig. 12
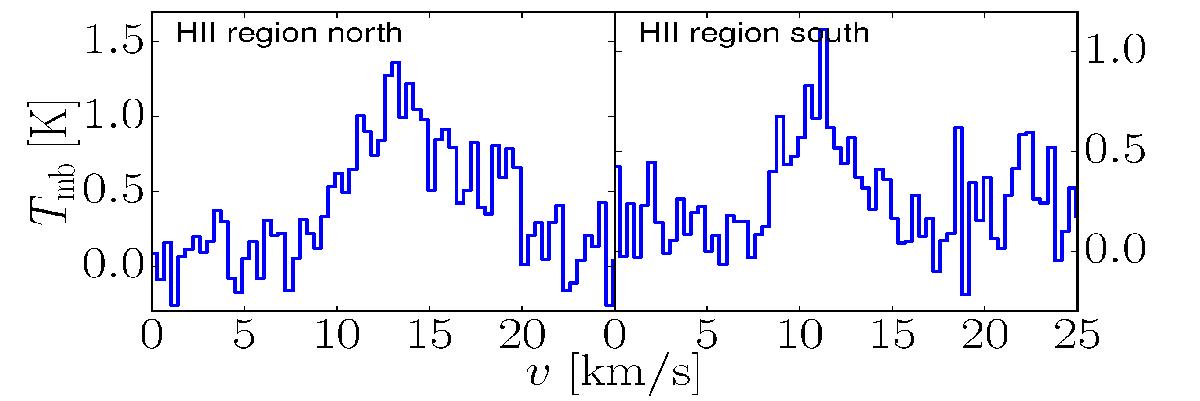
[C ii] spectra towards the H ii region, averaged over 156 (left) and 187 (right) pixels. The left panel represents the H ii region north of the Horsehead Nebula, the right panel represents the part south of the Horsehead Nebula. For the northern part, we obtain TP = 1.0 K, FWHM = 8.7 km s-1, and vP = 14.1 km s-1; for the southern part, a Gaussian fit yields TP = 0.7 K, FWHM = 5.2 km s-1, and vP = 11.2 km s-1.
Current usage metrics show cumulative count of Article Views (full-text article views including HTML views, PDF and ePub downloads, according to the available data) and Abstracts Views on Vision4Press platform.
Data correspond to usage on the plateform after 2015. The current usage metrics is available 48-96 hours after online publication and is updated daily on week days.
Initial download of the metrics may take a while.