Fig. 9
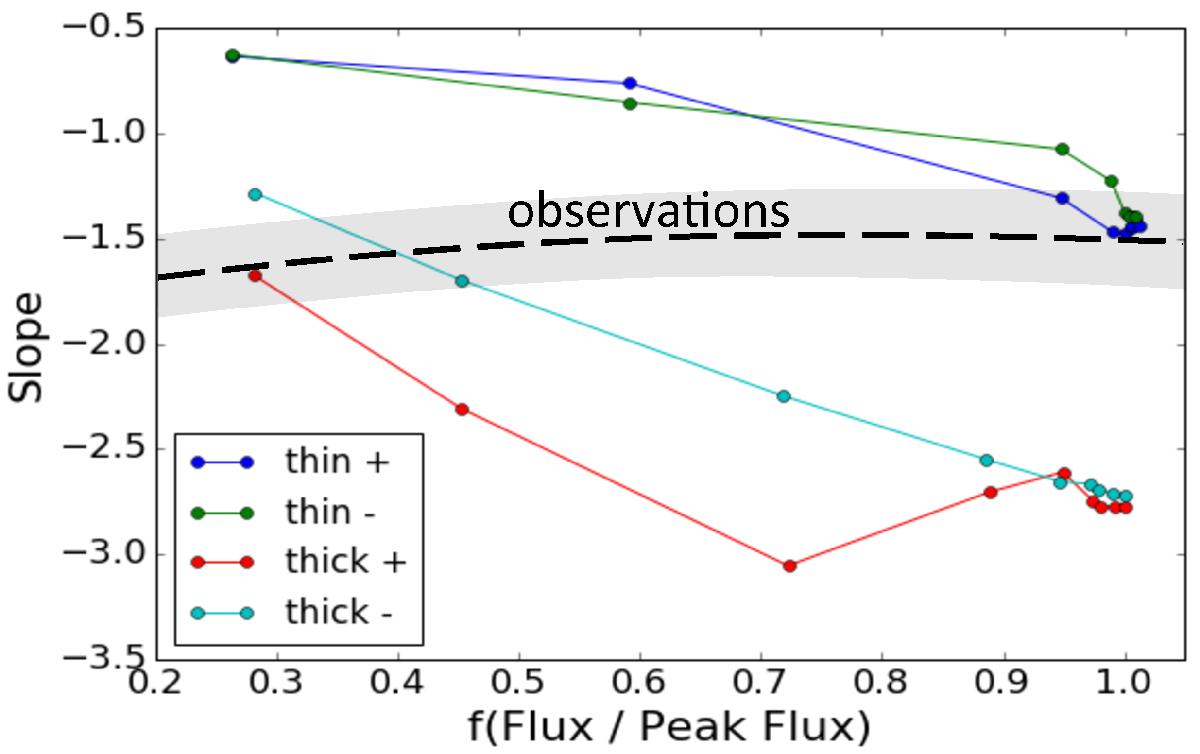
Evolution of the slope for the magnetograms from the braid model simulations of Prior & MacTaggart (2016). The slope values are plotted against the normalised flux, defined in Eq. (1), which characterises the evolutionary phase. These simulations are not symmetric, and the positive (+) and negative (–) distribution slopes are plotted separately for the thick and thin braid models. The observational trend is shown by the dashed black line, and the approximate range of observed slope values is indicated by the grey shaded region.
Current usage metrics show cumulative count of Article Views (full-text article views including HTML views, PDF and ePub downloads, according to the available data) and Abstracts Views on Vision4Press platform.
Data correspond to usage on the plateform after 2015. The current usage metrics is available 48-96 hours after online publication and is updated daily on week days.
Initial download of the metrics may take a while.