Fig. 6
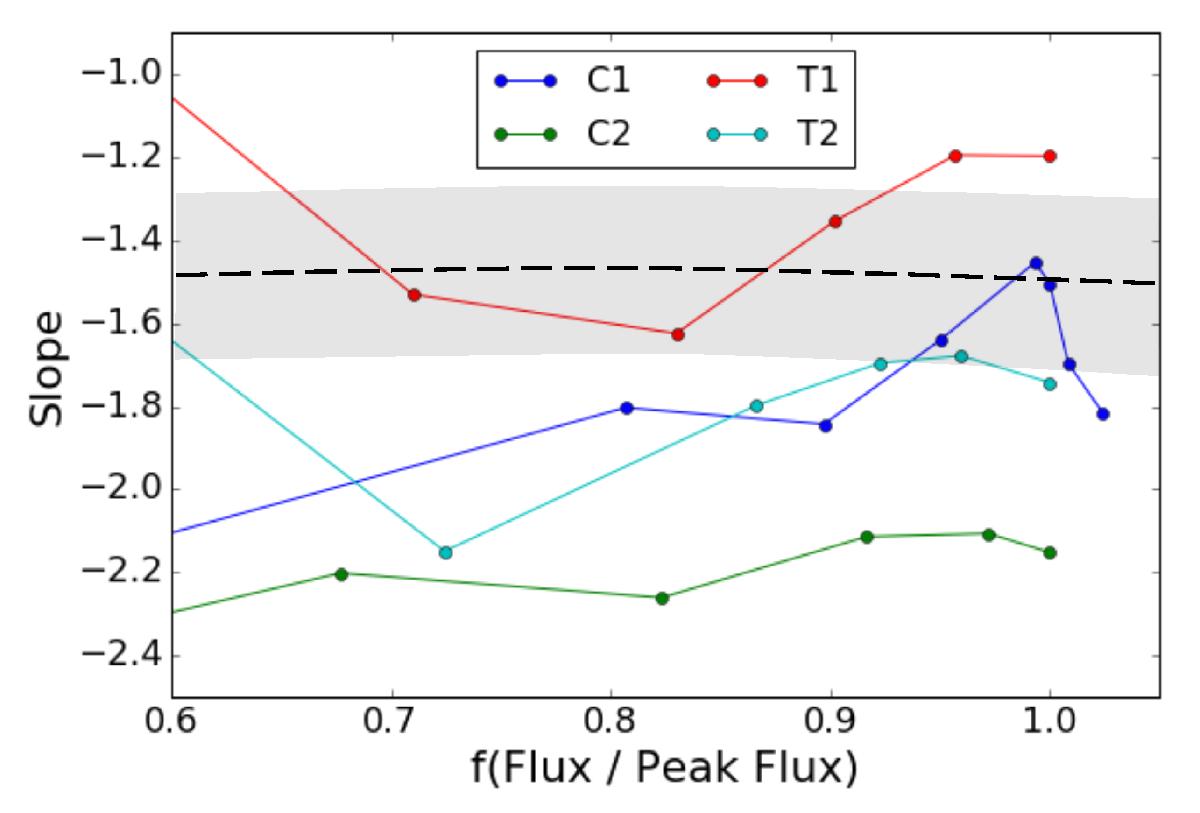
Evolution of the slope for the magnetograms from the simulations with a flux rope. C1 is the cylindrical case shown in Fig. 5, and C2 is the case with higher flux. T1 is the toroidal case shown in Fig. 5, with initial twist q = 0.2 /R, and T2 is the case with stronger twist, q = 0.4 /R, where R is the radius of the flux rope. The slope values are plotted against the normalised flux, defined in Eq. (1), which characterises the evolutionary phase. These simulations do not include the decay phase. The early emergence is not shown, as the distributions had no clear straight-line section at these times. For comparison, the observational trend is shown by the dashed black line, and the approximate range of observed slope values is indicated by the grey shaded region.
Current usage metrics show cumulative count of Article Views (full-text article views including HTML views, PDF and ePub downloads, according to the available data) and Abstracts Views on Vision4Press platform.
Data correspond to usage on the plateform after 2015. The current usage metrics is available 48-96 hours after online publication and is updated daily on week days.
Initial download of the metrics may take a while.