Fig. 5
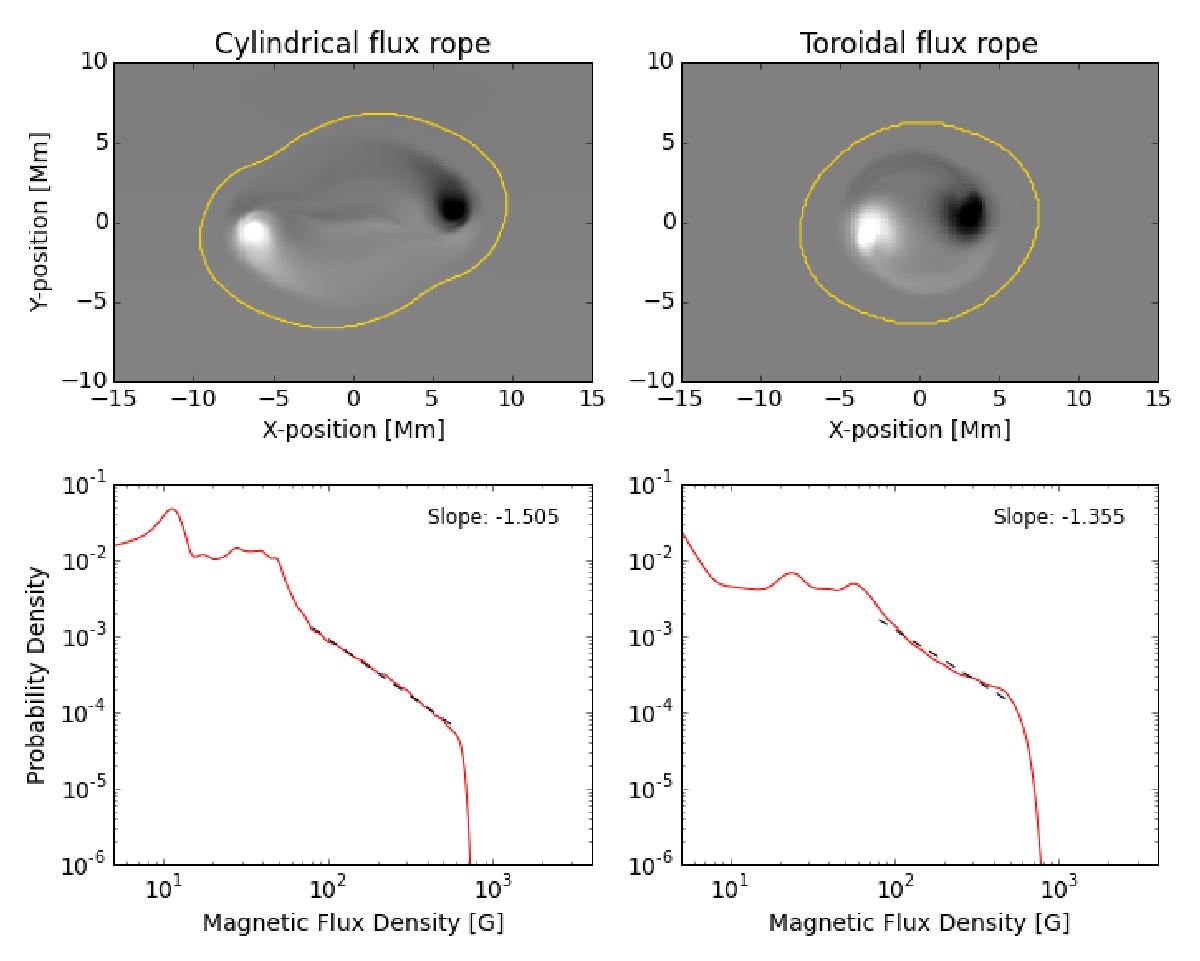
Magnetograms from simulations using a cylindrical flux rope (left, case C1 Leake et al. 2013) and a toroidal flux rope (right, case T1 MacTaggart & Hood 2009; Hood et al. 2012) and their corresponding distributions. These snapshots were taken near the end of their emergence phases, and the magnetograms show a close-up view of the emerging regions. The yellow contours outline the area taken for the distribution analysis.
Current usage metrics show cumulative count of Article Views (full-text article views including HTML views, PDF and ePub downloads, according to the available data) and Abstracts Views on Vision4Press platform.
Data correspond to usage on the plateform after 2015. The current usage metrics is available 48-96 hours after online publication and is updated daily on week days.
Initial download of the metrics may take a while.