Fig. 2
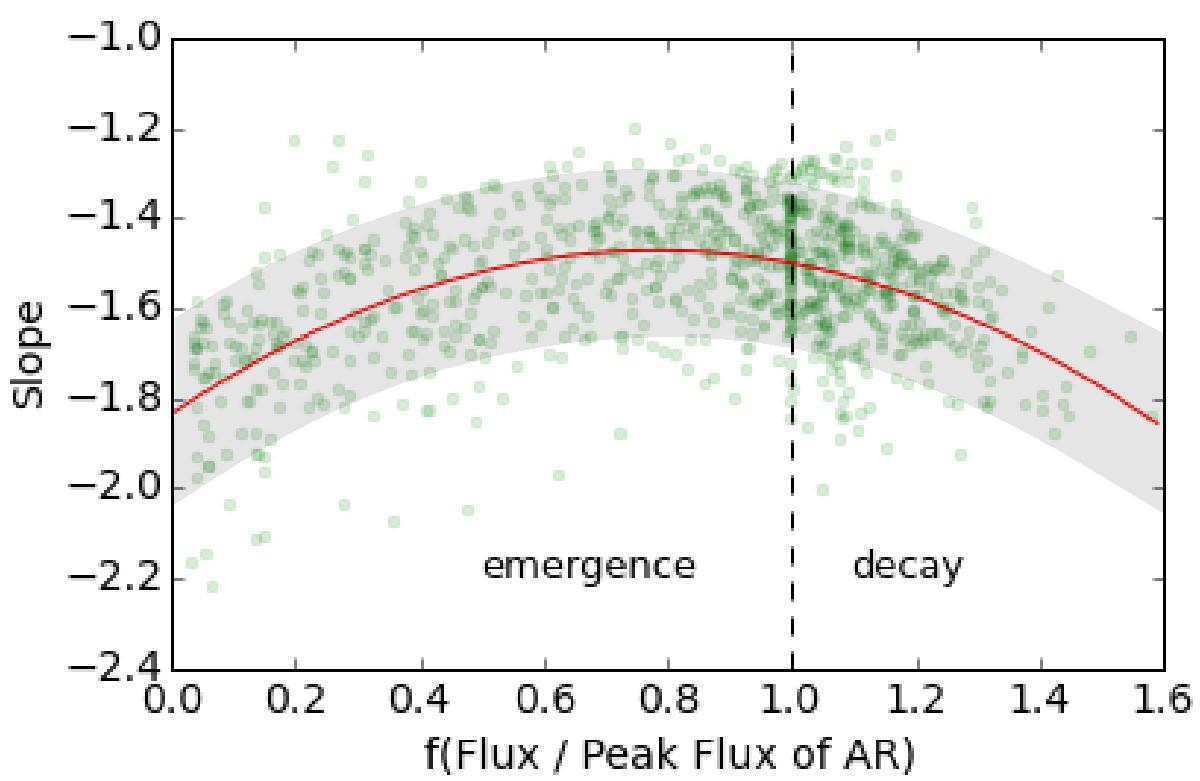
Observed evolution of the slopes. The emerging and decaying phases are distinguished by the function f(F/Fmax) defined by Eq. (1), where F is the magnetic flux averaged between the two magnetic polarities, and Fmax is its maximum value. The green points show individual distribution slope values obtained during the evolution of the leading and following magnetic polarities for 24 active regions. The red line shows the general trend (second-order polynomial least-squares fitted to the data points). The grey shaded area gives an indication of the spread of the data points. This summarises the main results of Dacie et al. (2016).
Current usage metrics show cumulative count of Article Views (full-text article views including HTML views, PDF and ePub downloads, according to the available data) and Abstracts Views on Vision4Press platform.
Data correspond to usage on the plateform after 2015. The current usage metrics is available 48-96 hours after online publication and is updated daily on week days.
Initial download of the metrics may take a while.