Fig. 7
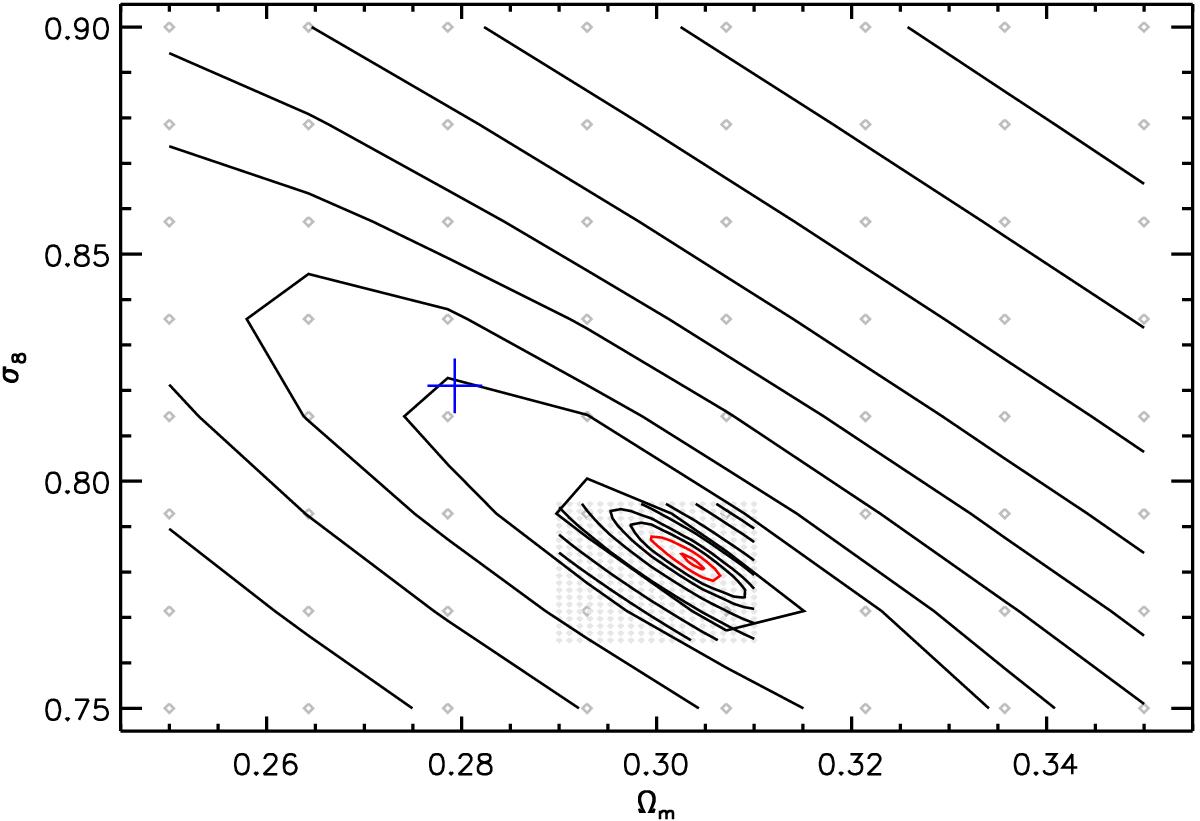
eROSITA cosmology contours for biased mass function for ΩM versus σ8. The cross shows the input (true) cosmology value. The black contours give the sum of the offset significance between the biased and fit mass function. The contours were obtained by interpolating the offset significance values calculated for the grid of cosmological parameters (see grey diamonds). The red contours show the 1 and 3σ confidence level. The plot shows more coarse and finer contour levels around the best-fit values.
Current usage metrics show cumulative count of Article Views (full-text article views including HTML views, PDF and ePub downloads, according to the available data) and Abstracts Views on Vision4Press platform.
Data correspond to usage on the plateform after 2015. The current usage metrics is available 48-96 hours after online publication and is updated daily on week days.
Initial download of the metrics may take a while.