Fig. 6
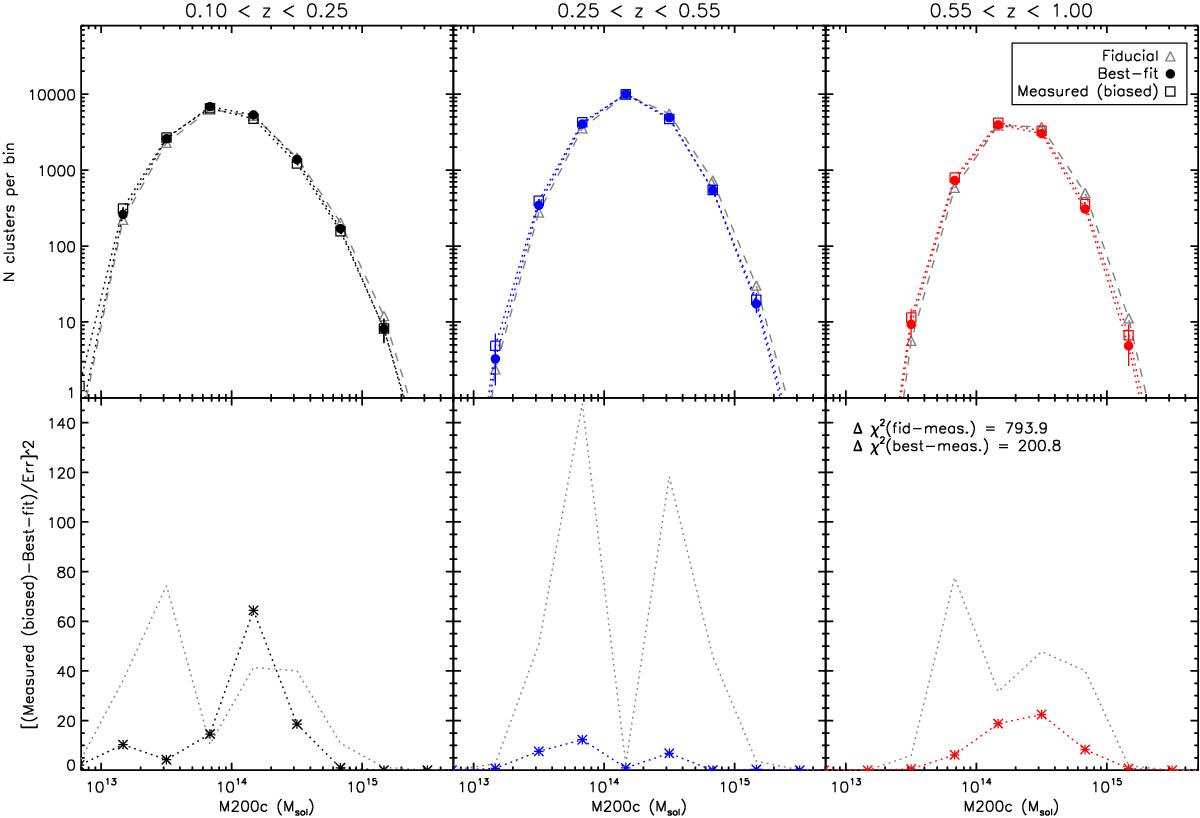
eROSITA mass function bias in different redshift bins. The top panels show the mass function (number of clusters in a given mass range M200c) in increasing redshift ranges (left: 0.1 to 0.25, middle: 0.25 to 0.55, right: 0.55 to 1.0). The triangles show the eROSITA mass function as expected in the standard cosmology (fiducial cosmology WMAP9, Hinshaw et al. 2013). The open squares show the same mass function but with the estimated mass bias of about 7.5 per cent. The filled circles show the mass function for the best-fit cosmological parameters to the biased mass function. The errors on data-points are Poisson errors on the number of clusters per bin. The bottom panels show the offset significance between the fiducial model and biased mass function (grey dotted lines) and between the best-fit model and the biased mass function (crosses with coloured dotted line).
Current usage metrics show cumulative count of Article Views (full-text article views including HTML views, PDF and ePub downloads, according to the available data) and Abstracts Views on Vision4Press platform.
Data correspond to usage on the plateform after 2015. The current usage metrics is available 48-96 hours after online publication and is updated daily on week days.
Initial download of the metrics may take a while.