Fig. 5
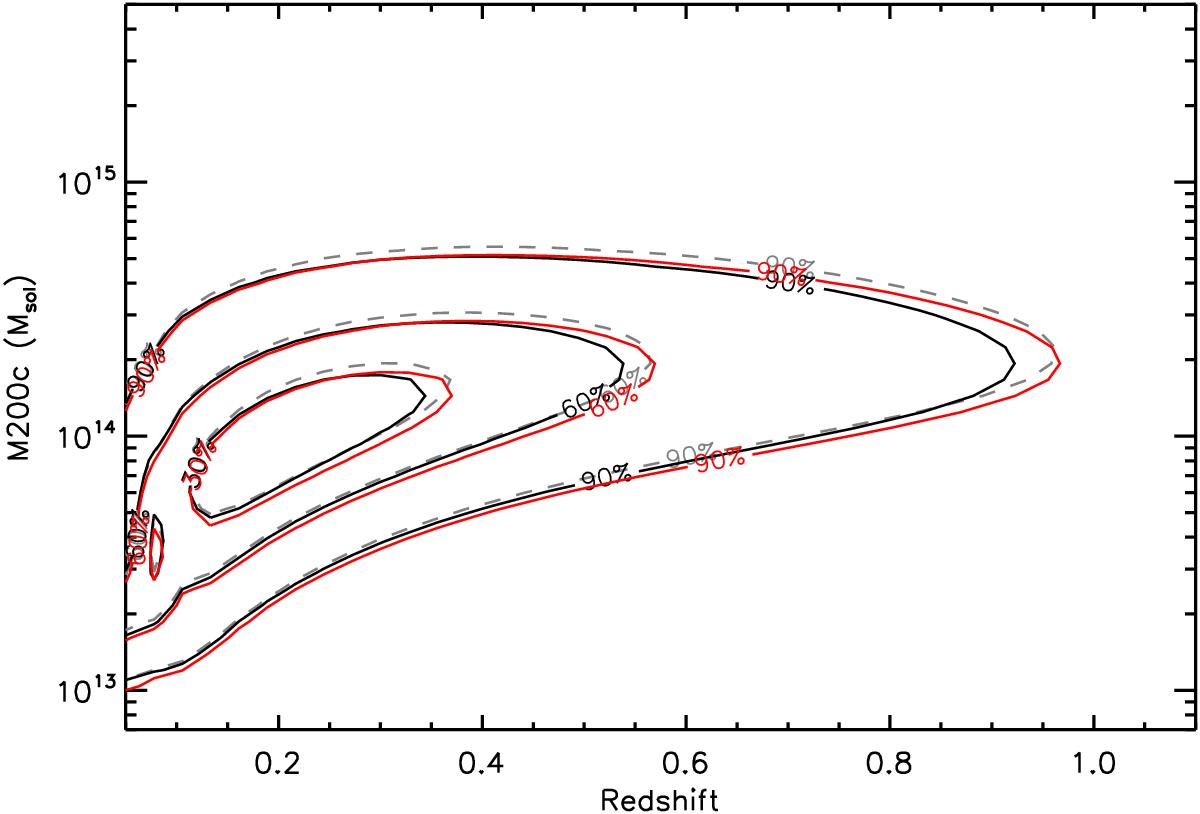
Simulation of observed eROSITA cluster density in the redshift – mass (M200c) plane. The total number of clusters is ~105. The contours include the denoted fraction of total observed clusters in the four-year all-sky survey. The grey dotted (higher in mass) contours show the expected observed distribution accounting for the selection function of the eROSITA survey. The red (lower in mass) contours show the distribution as it will be measured with a five per cent low bias in X-ray halo temperatures. The solid black contours indicate best-fit mass function (see below).
Current usage metrics show cumulative count of Article Views (full-text article views including HTML views, PDF and ePub downloads, according to the available data) and Abstracts Views on Vision4Press platform.
Data correspond to usage on the plateform after 2015. The current usage metrics is available 48-96 hours after online publication and is updated daily on week days.
Initial download of the metrics may take a while.