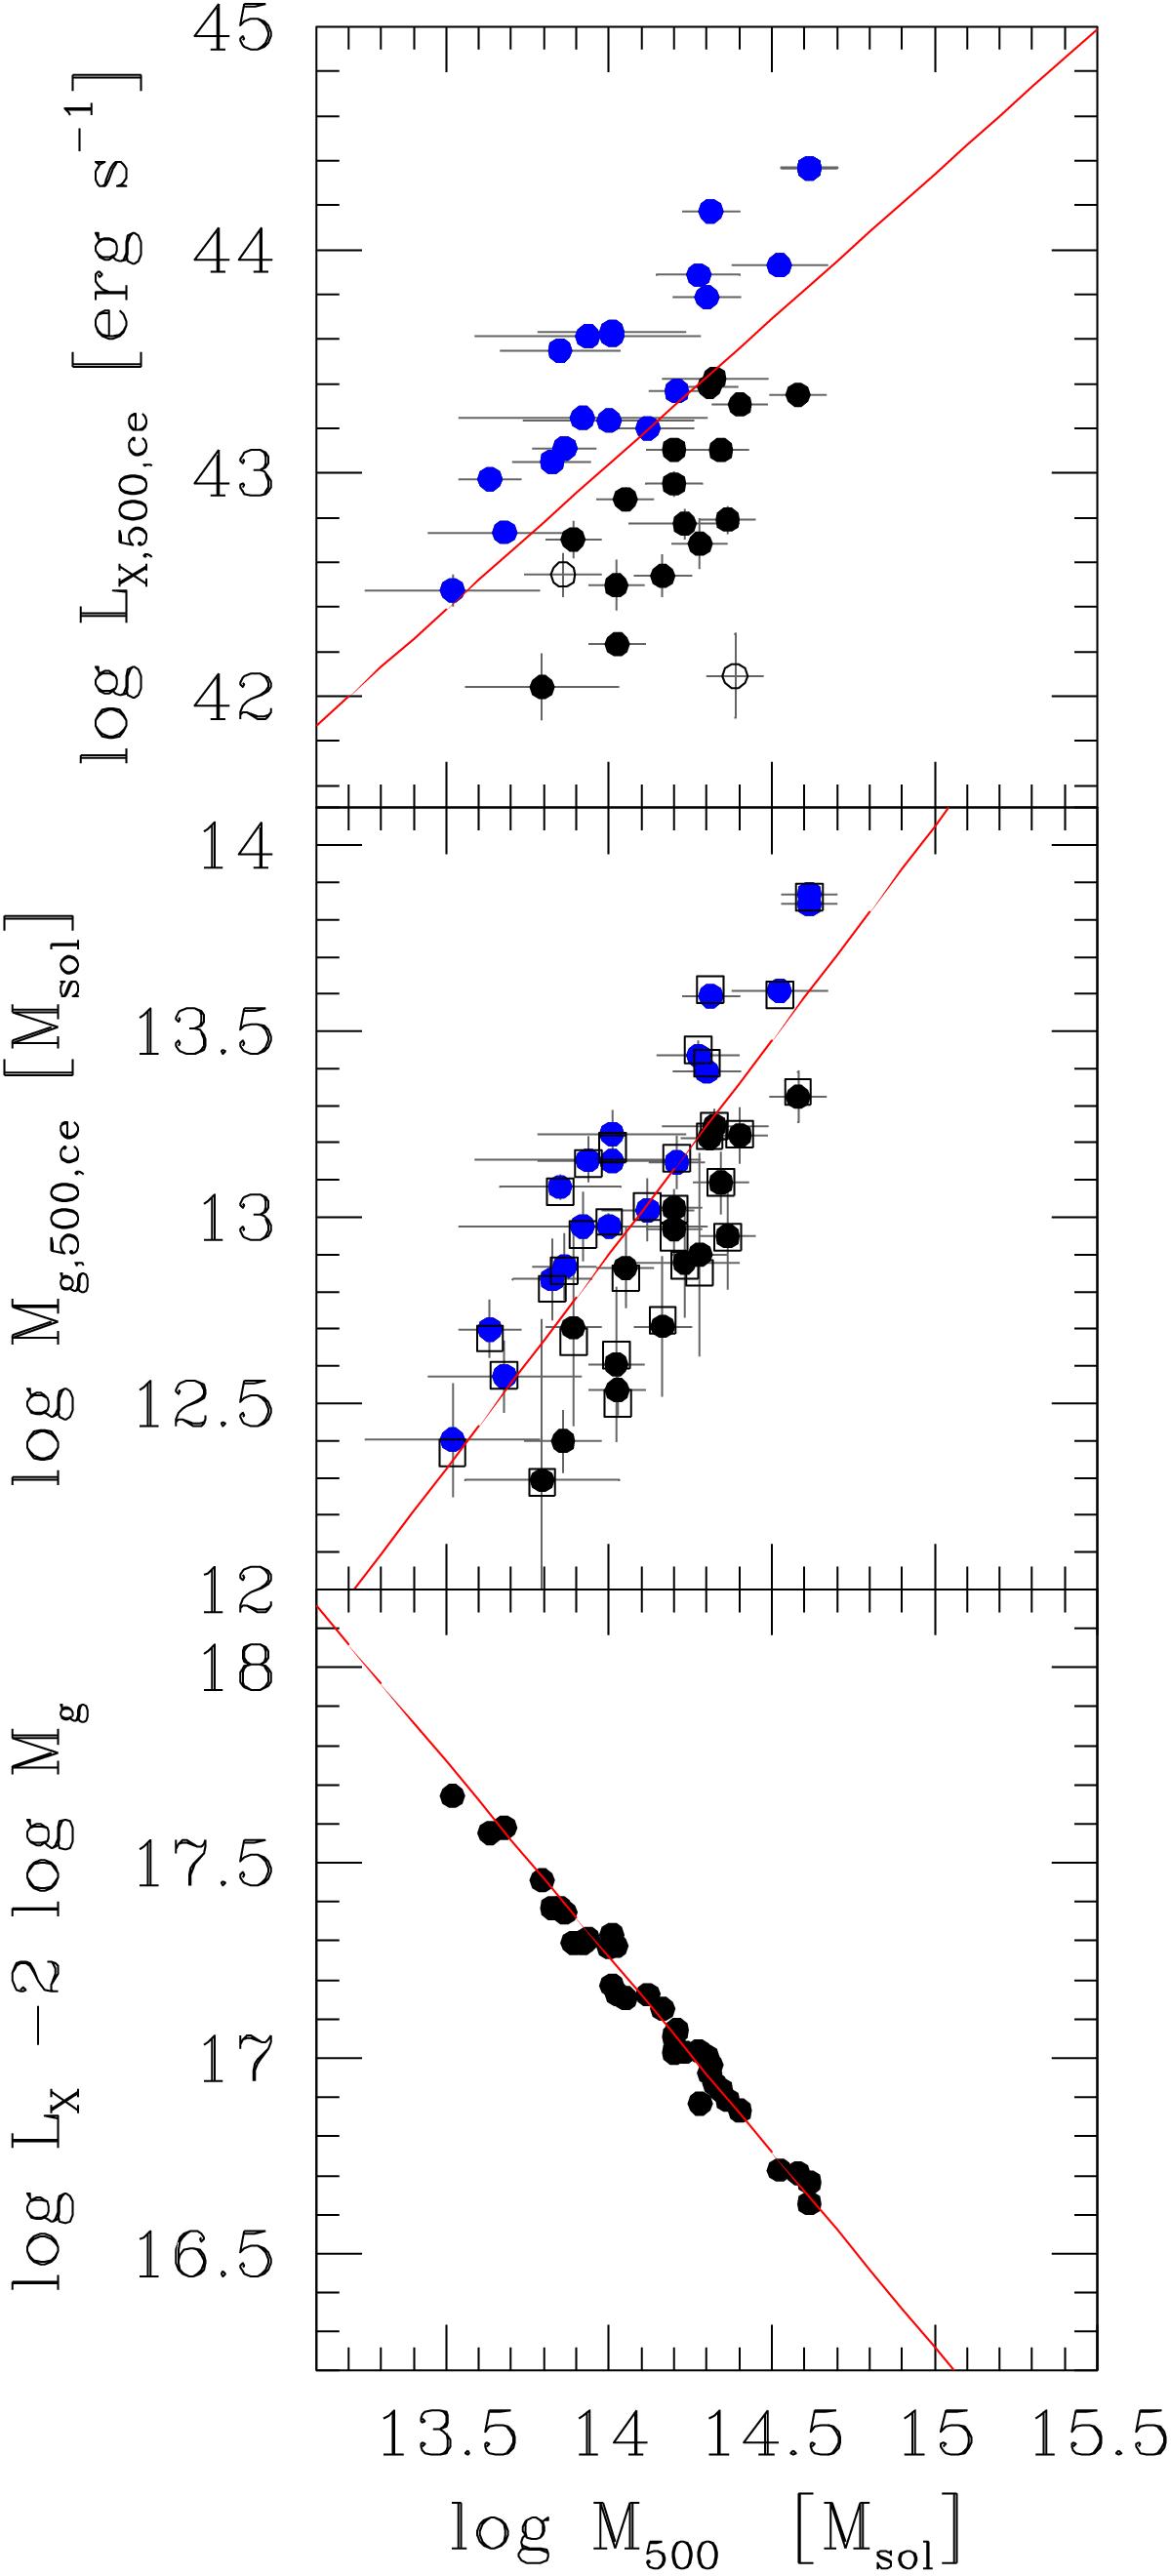
Fig. 4

Core-excised [0.5–2] keV luminosity (upper panel), core-excised gas mass (central panel), or a combination of them (bottom panel) vs. caustic mass. The red lines indicate the mean fit from this work (bottom panel) or (top panel) that derived using Eq. (4) from the gas mass slope in Andreon (2010). The squares in the central panel show the expected gas mass derived from LX values in the top panel. These are not plotted for the two open points in the top panel, which are clusters without gas mass estimates. Points indicated in blue are above average in LX | M also turn out to be above average in Mgas | M. Clusters with measurements coming from two X-ray telescopes are shown twice, but the two points may be almost perfectly overlapping in one of the panels (for example, the brightest cluster in the top panel) and therefore do not show up as such.
Current usage metrics show cumulative count of Article Views (full-text article views including HTML views, PDF and ePub downloads, according to the available data) and Abstracts Views on Vision4Press platform.
Data correspond to usage on the plateform after 2015. The current usage metrics is available 48-96 hours after online publication and is updated daily on week days.
Initial download of the metrics may take a while.


