Fig. 5
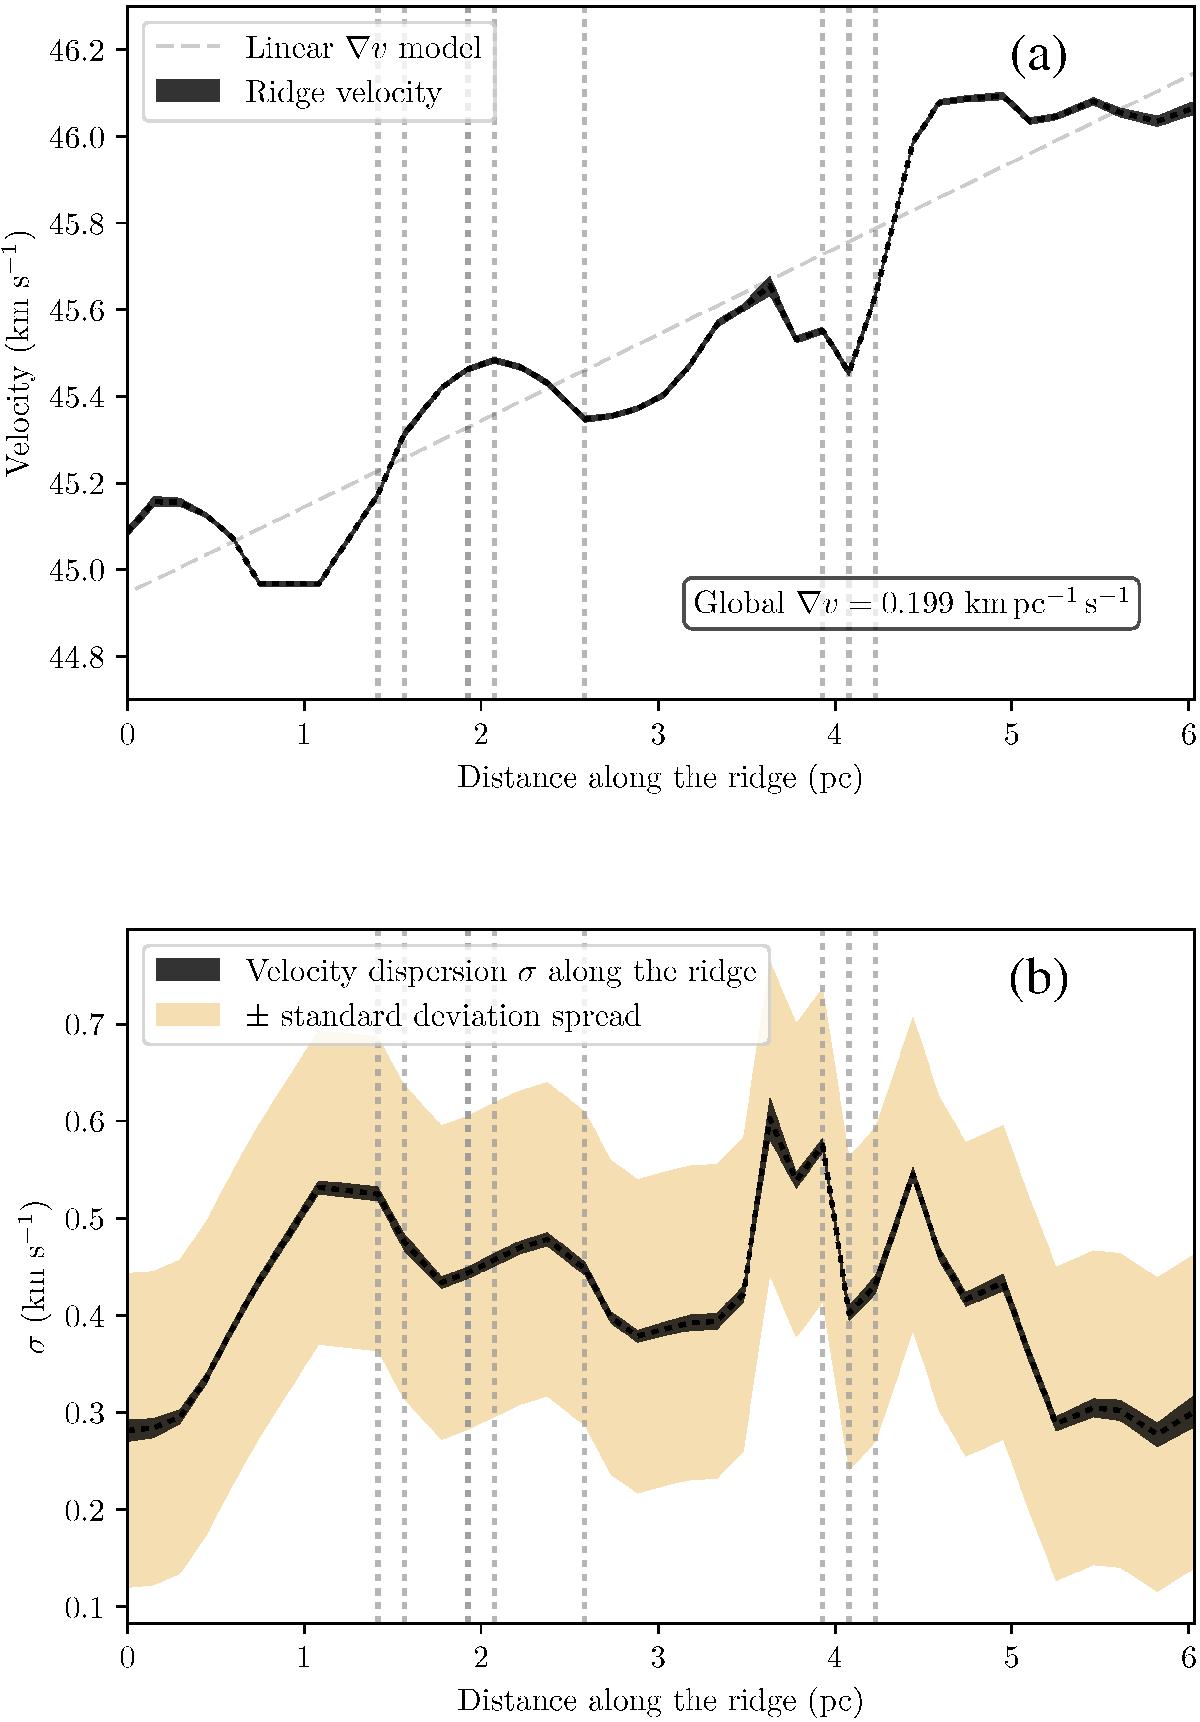
Panel a: The radial velocity profile of the main component along the G035.39 filament, starting at its southernmost point. The solid black line shows the radial velocities fit at the intensity ridge of the IRDC. The width of the solid black line represents the fitting uncertainty at each point. The vertical dotted lines mark the projected locations of the massive protostellar cores from Nguyen Luong et al. (2011). Panel b: Same as a, but for the velocity dispersion profile along the IRDC ridge. The yellow shaded region denotes the spread area given by two standard deviations of all σ values in the main velocity component.
Current usage metrics show cumulative count of Article Views (full-text article views including HTML views, PDF and ePub downloads, according to the available data) and Abstracts Views on Vision4Press platform.
Data correspond to usage on the plateform after 2015. The current usage metrics is available 48-96 hours after online publication and is updated daily on week days.
Initial download of the metrics may take a while.