Fig. 3
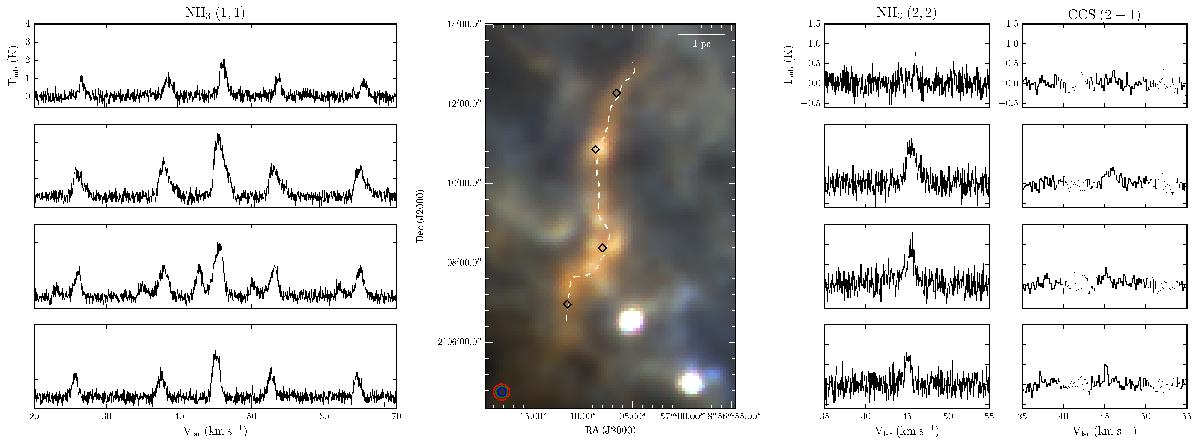
A composite Hi-GAL color image of the infrared dark cloud. Red, green, and blue channels correspond to 350, 250, and 160 μm, respectively. To the left of the Herschel map, four NH3 (1, 1) spectra are shown, and four selected NH3 (2, 2) and CCS (2–1) lines are displayed on the right side of the central figure. The CCS spectra are smoothed to 0.12 km s-1. Each row of spectra is arranged to match the black diamond markers shown on the FIR map, selected to represent typical spectra along the filament. The filament ridge, as defined in Sect. 2.1, is marked with a dashed white line.
Current usage metrics show cumulative count of Article Views (full-text article views including HTML views, PDF and ePub downloads, according to the available data) and Abstracts Views on Vision4Press platform.
Data correspond to usage on the plateform after 2015. The current usage metrics is available 48-96 hours after online publication and is updated daily on week days.
Initial download of the metrics may take a while.