Fig. 9
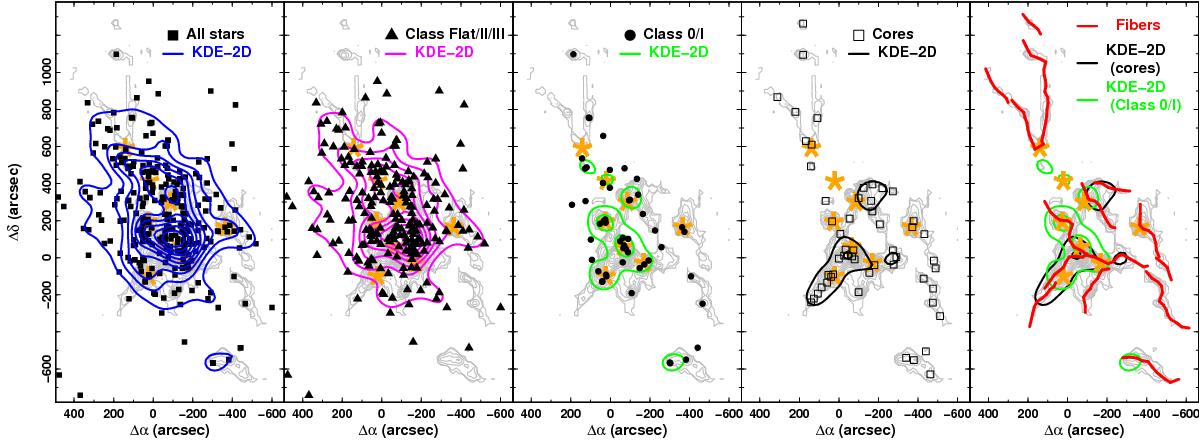
Spatial distribution and surface density of stars and gas within NGC 1333 obtained using 2D KDEs with a FWHM = 220 arcsec. From left to right: (1) all stars (solid squares); (2) Classes Flat, II, and III (solid triangles); (3) Classes 0/I (solid circles); (4) dense cores (open squares); (5) fiber axis (red lines). Contour levels are equally spaced every 100 objects pc-2 in all submaps. For reference, the N2H+ emission (grey contours) as well as the positions of the different IRAS sources (orange stars) are indicated in all subpanels.
Current usage metrics show cumulative count of Article Views (full-text article views including HTML views, PDF and ePub downloads, according to the available data) and Abstracts Views on Vision4Press platform.
Data correspond to usage on the plateform after 2015. The current usage metrics is available 48-96 hours after online publication and is updated daily on week days.
Initial download of the metrics may take a while.