Fig. 8
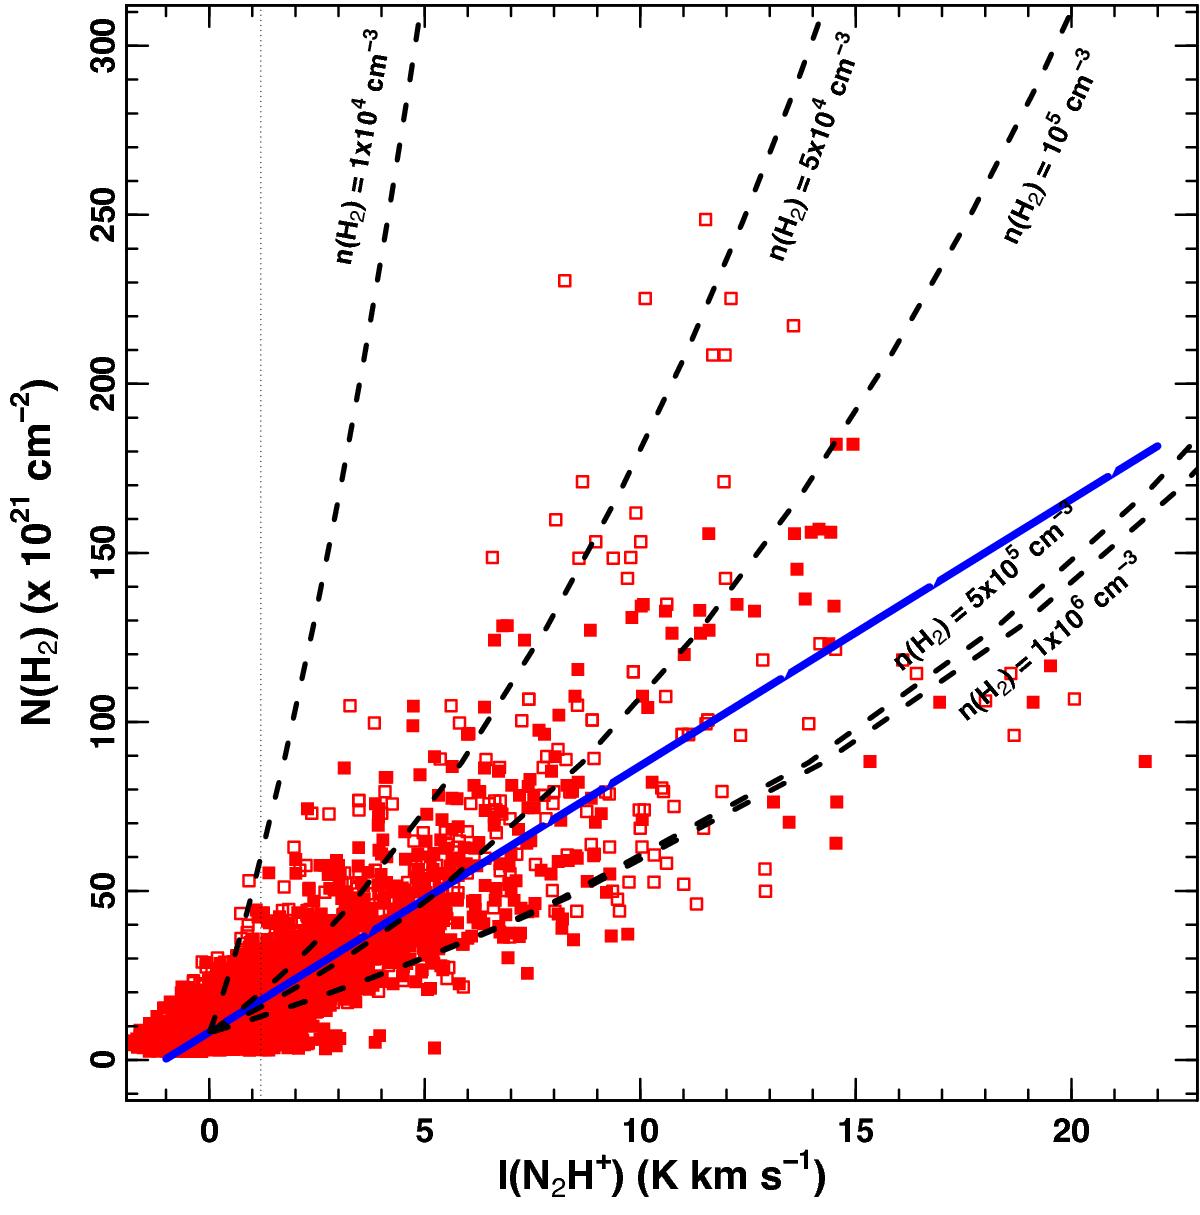
Comparison between the N2H+ (1–0) integrated intensity (i.e., I(N2H+)) and H2 column density (i.e., N(H2)) in NGC 1333. The vertical dotted line indicates the intensity threshold defining the first contour of the emission map in Fig. 5. The linear fit describing Eq. (4) is displayed by a blue solid line. Symbols are similar to those in Fig. 4. RADEX radiative transfer calculations for N2H+ (1–0) emission at densities n(H2) = [ 0.1, 0.5, 1.0, 5, 10 ] × 105 cm-3 are overploted using black dashed lines (see text).
Current usage metrics show cumulative count of Article Views (full-text article views including HTML views, PDF and ePub downloads, according to the available data) and Abstracts Views on Vision4Press platform.
Data correspond to usage on the plateform after 2015. The current usage metrics is available 48-96 hours after online publication and is updated daily on week days.
Initial download of the metrics may take a while.