Fig. 7
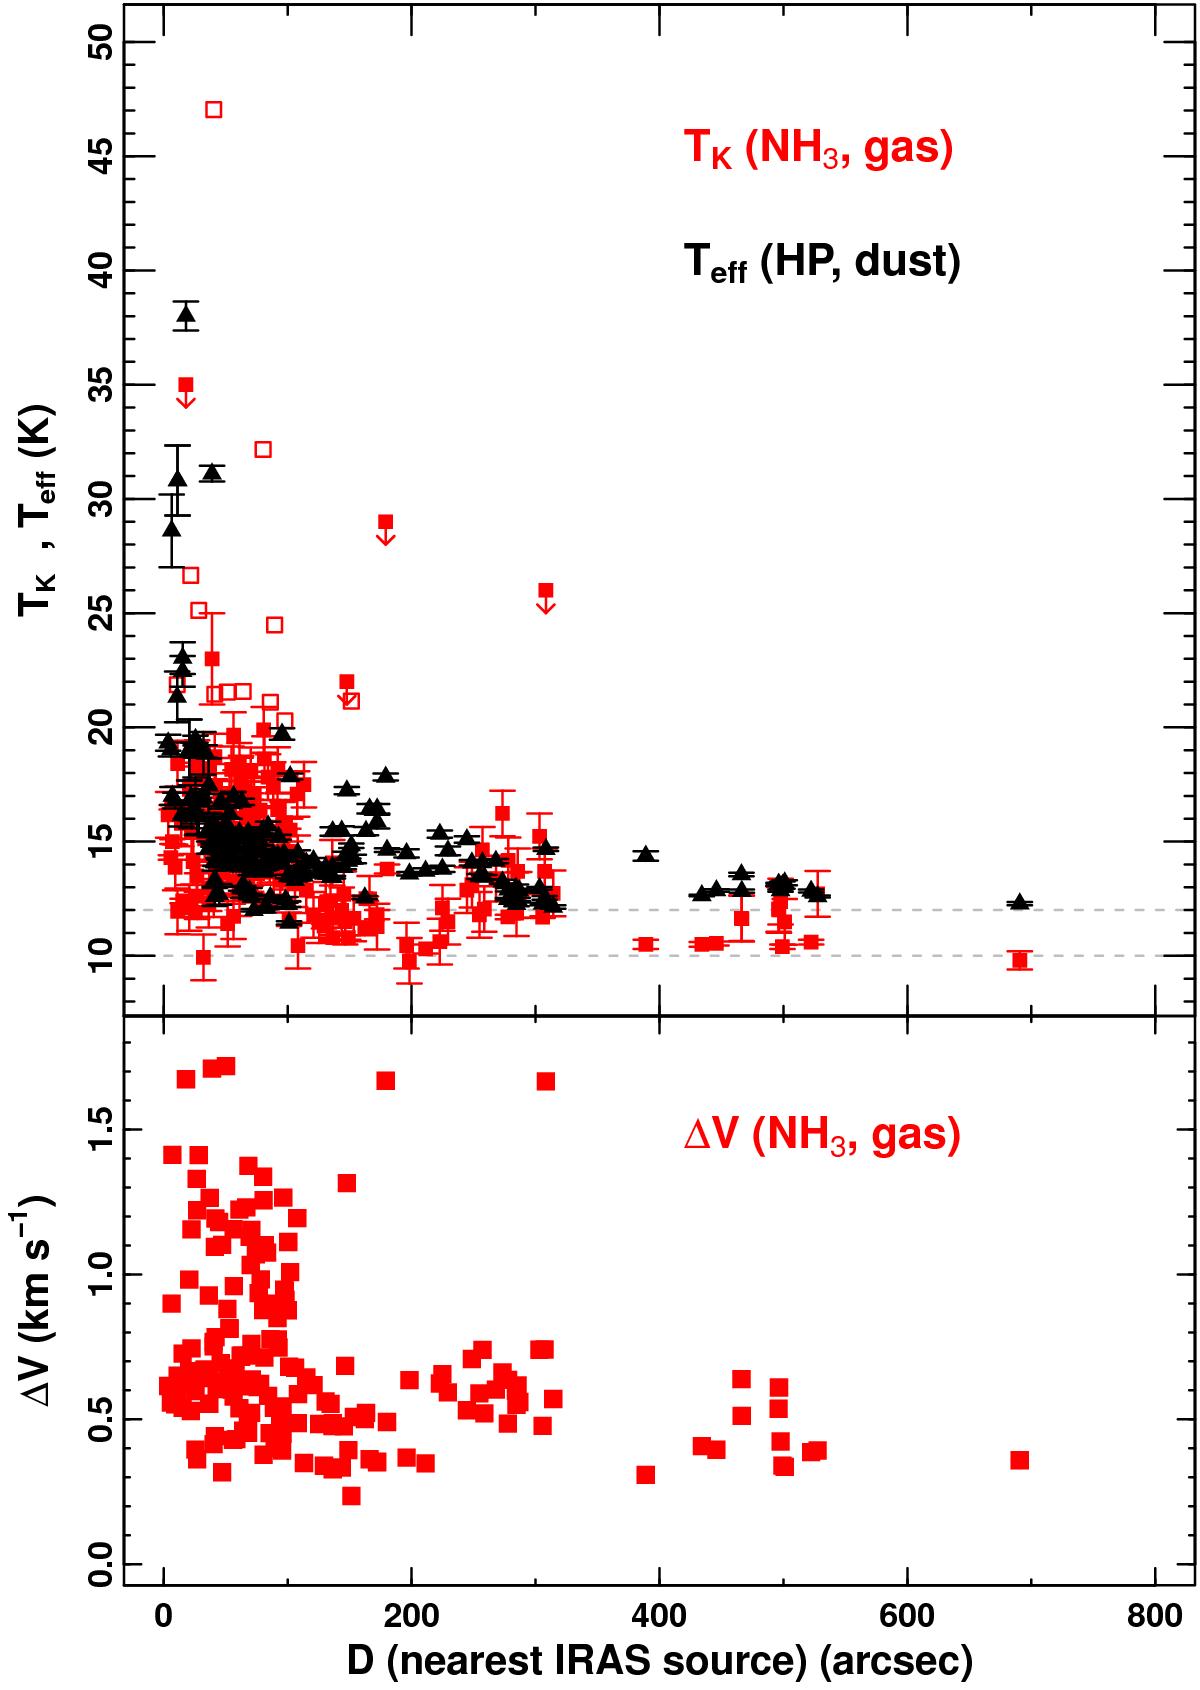
Upper panel: gas kinetic (TK; red squares) and dust effective (Teff; black triangles) temperatures as a function of the projected radius to the nearest IRAS source within NGC 1333. The plot combines all positions with derived TK values in this work together with those surveyed by Rosolowsky et al. (2008). The bars indicate the 1σ errors of both gas and dust temperatures, respectively. The red open squares indicate positions with TK> 20 K values (see text). The arrows indicate positions with TK values listed as upper-limits by Rosolowsky et al. (2008). Lower panel: measured ammonia linewidths (ΔV) within the same positions.
Current usage metrics show cumulative count of Article Views (full-text article views including HTML views, PDF and ePub downloads, according to the available data) and Abstracts Views on Vision4Press platform.
Data correspond to usage on the plateform after 2015. The current usage metrics is available 48-96 hours after online publication and is updated daily on week days.
Initial download of the metrics may take a while.