Fig. 6
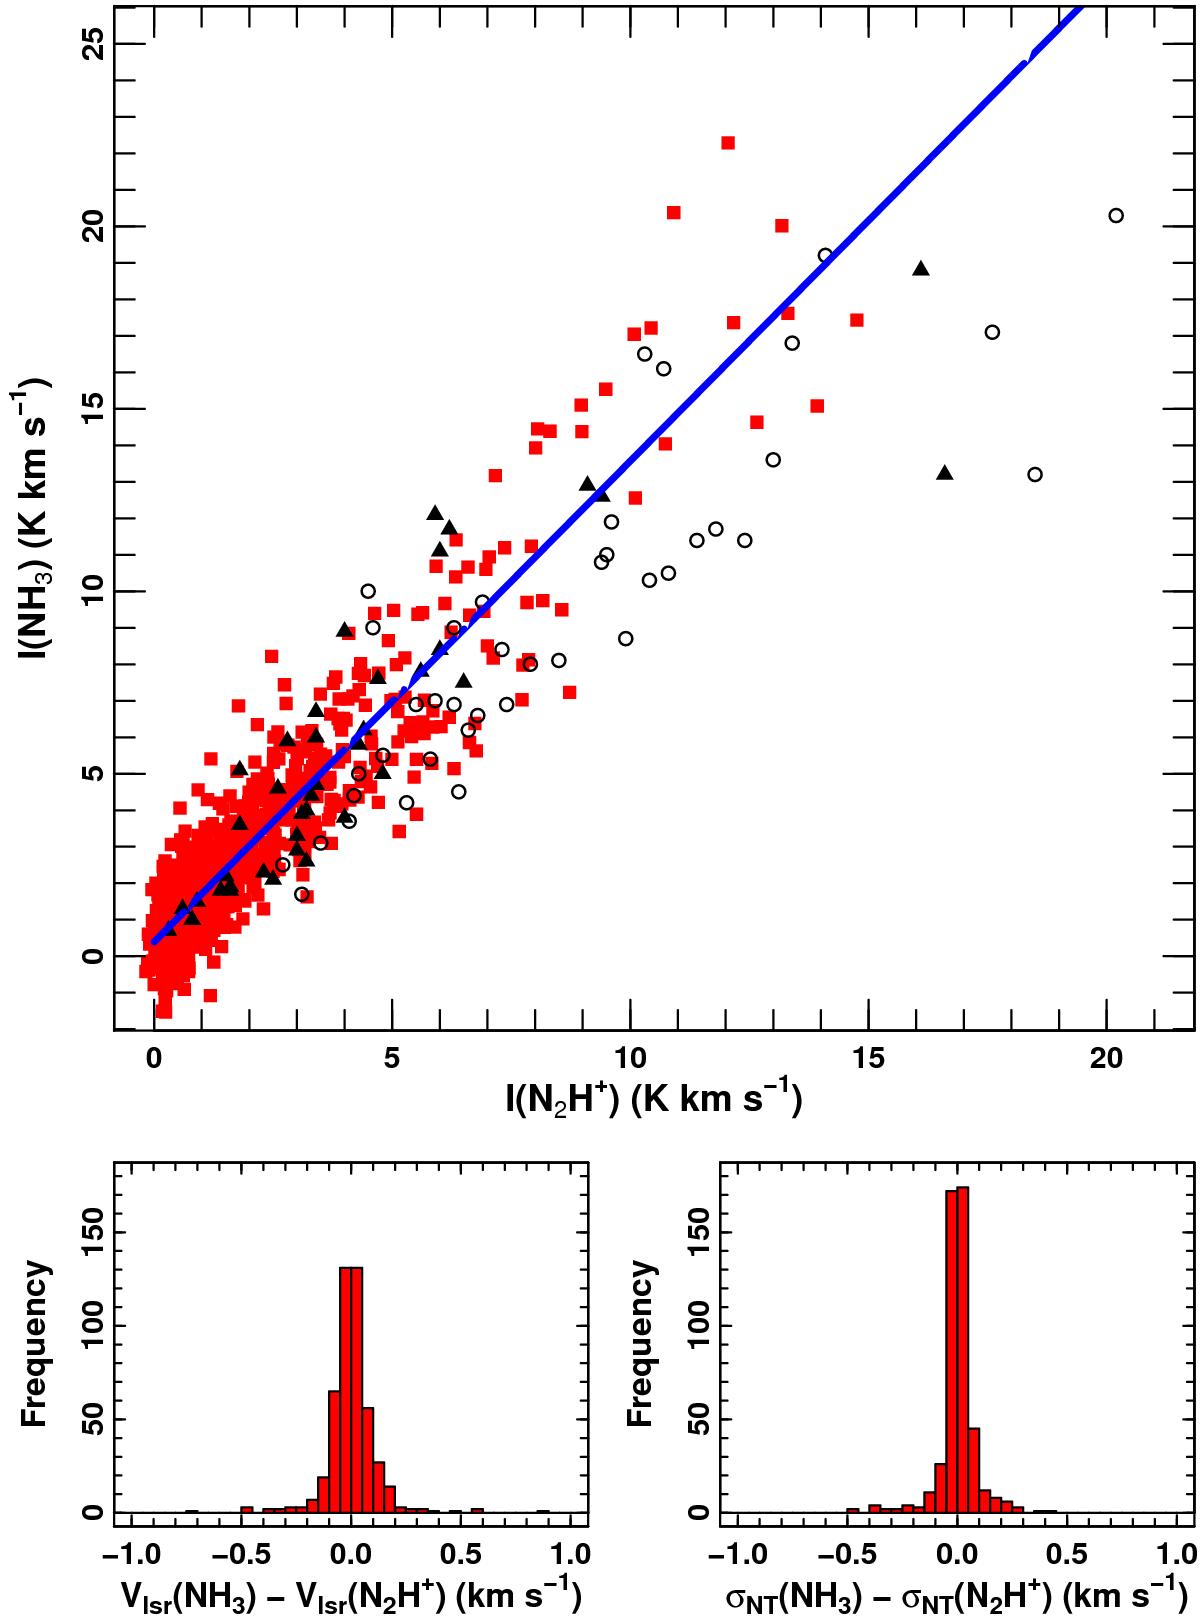
Upper panel: pixel-to-pixel comparison between the N2H+ (1–0) and NH3 (1, 1) integrated emission within NGC 1333, both convolved to 60 arcsec. The blue line denotes the linear fit described by Eq. (3). The results obtained in Perseus by Johnstone et al. (2010) for both prestellar (solid triangles) and protostellar cores (open circles) are superposed in black. Lower subpanels: histograms of the differences in velocity (left) and non-thermal velocity dispersion (right) between N2H+ and NH3 for all the positions fitted with a S/N ≥ 3. For positions with multiple lines, only the comparison to the nearest component in velocity is displayed (see Sect. 5 for a discussion of the gas kinematics).
Current usage metrics show cumulative count of Article Views (full-text article views including HTML views, PDF and ePub downloads, according to the available data) and Abstracts Views on Vision4Press platform.
Data correspond to usage on the plateform after 2015. The current usage metrics is available 48-96 hours after online publication and is updated daily on week days.
Initial download of the metrics may take a while.