Fig. 5
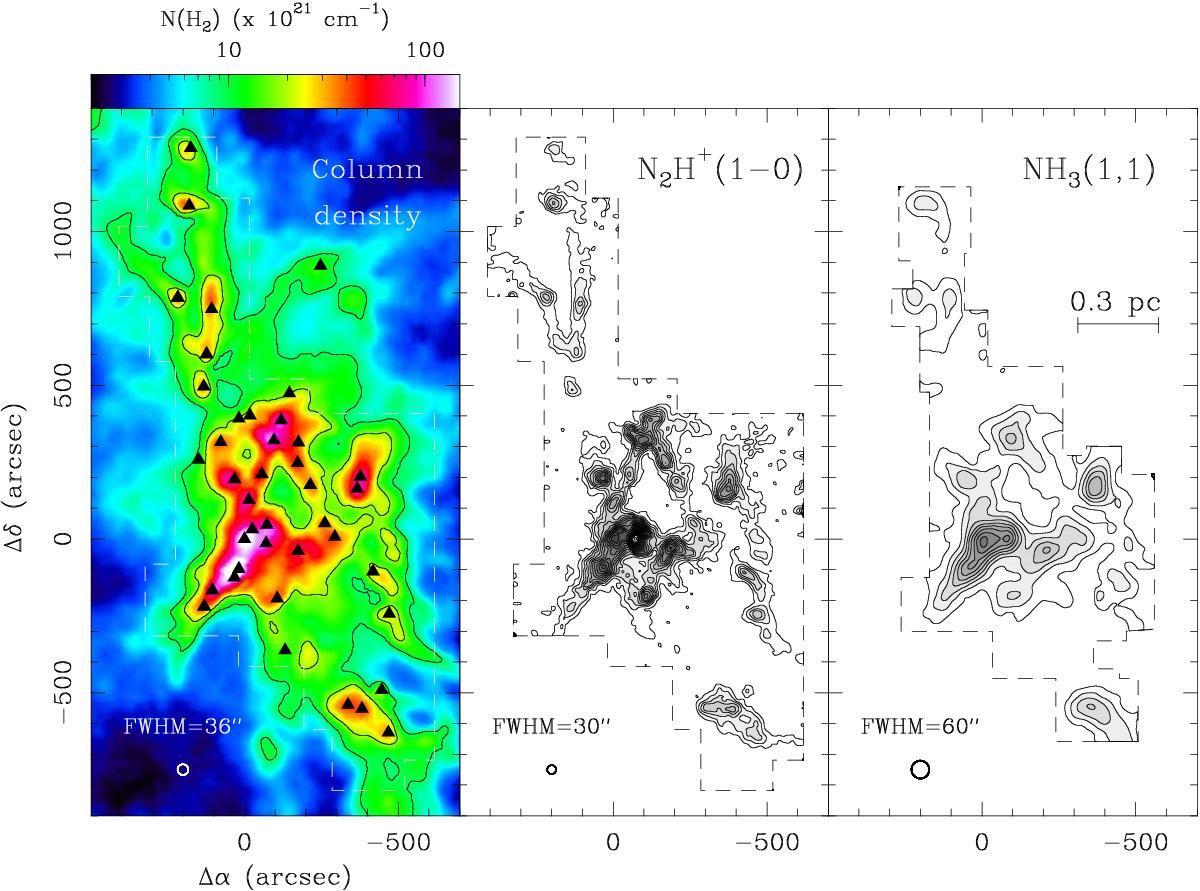
Left: total gas column density towards the NGC 1333 central clump. Contours similar to Fig. 2. The solid triangles indicate the position of the different dense cores identified by Rosolowsky et al. (2008). Centre: N2H+ (1–0) integrated emission map obtained with the IRAM 30 m telescope. Right: NH3 (1, 1) integrated emission map obtained with the Effelsberg 100 m telescope. Offsets are referred to the map centre with coordinates ![]() in radio projection. Contours are equally spaced every 1.2 K km s-1 and 1.0 K km s-1 in the N2H+ and NH3 maps, respectively. In each case, the area surveyed by our molecular observations is enclosed by a dashed line. The area mapped in N2H+ is also delineated by a white dashed line on the left panel. The different FWHM are indicated at the lower left corner in the corresponding plots.
in radio projection. Contours are equally spaced every 1.2 K km s-1 and 1.0 K km s-1 in the N2H+ and NH3 maps, respectively. In each case, the area surveyed by our molecular observations is enclosed by a dashed line. The area mapped in N2H+ is also delineated by a white dashed line on the left panel. The different FWHM are indicated at the lower left corner in the corresponding plots.
Current usage metrics show cumulative count of Article Views (full-text article views including HTML views, PDF and ePub downloads, according to the available data) and Abstracts Views on Vision4Press platform.
Data correspond to usage on the plateform after 2015. The current usage metrics is available 48-96 hours after online publication and is updated daily on week days.
Initial download of the metrics may take a while.